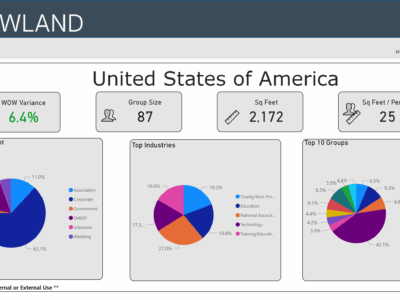
Weekly Group Meetings and Events Stats, Week Ending September 14, 2024
Washington DC attracts more groups with nearly 5x volume growth for the week
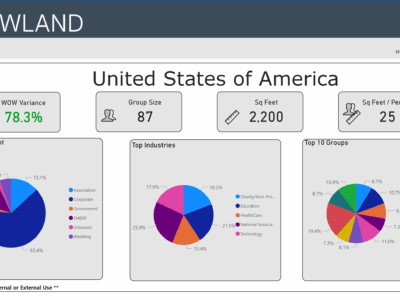
For the week ending September 14, 2024, the U.S. meetings and events volume increased 78.3% compared to the previous week. Post-summer and holiday break, organizations are …