• Skip to primary navigation
  • Skip to main content
  • Skip to primary sidebar
  • Skip to footer
Knowland

Knowland

  • Solutions
    • Hotel Properties
    • Above Property Management
      • Portfolio Capture
      • Market Analytics
    • CVBs and DMOs
    • Features & Pricing
    • Certifications
  • Resources
    • Hospitality Group & Business Performance Index
    • Success Stories
    • White Papers & Datasheets
    • Webcasts & Events
    • Blog
    • Sales Calculator
    • Glossary
  • Customers
    • Customer Sign In >
    • Support & Training
    • Billing Inquiries >
  • About Us
    • Meet Knowland
    • Culture
    • Job Openings
    • Press & Media
    • Sustainability
    • Contact Us
  • Support
  • Sign In
  • Try for Free
  • Request a Demo
  • Support
  • Sign In >
TRY FOR FREE REQUEST DEMO

Weekly Group Meetings and Events Stats, Week Ending October 28, 2023

October 30, 2023

Washington DC and Las Vegas lead week-over-week event growth

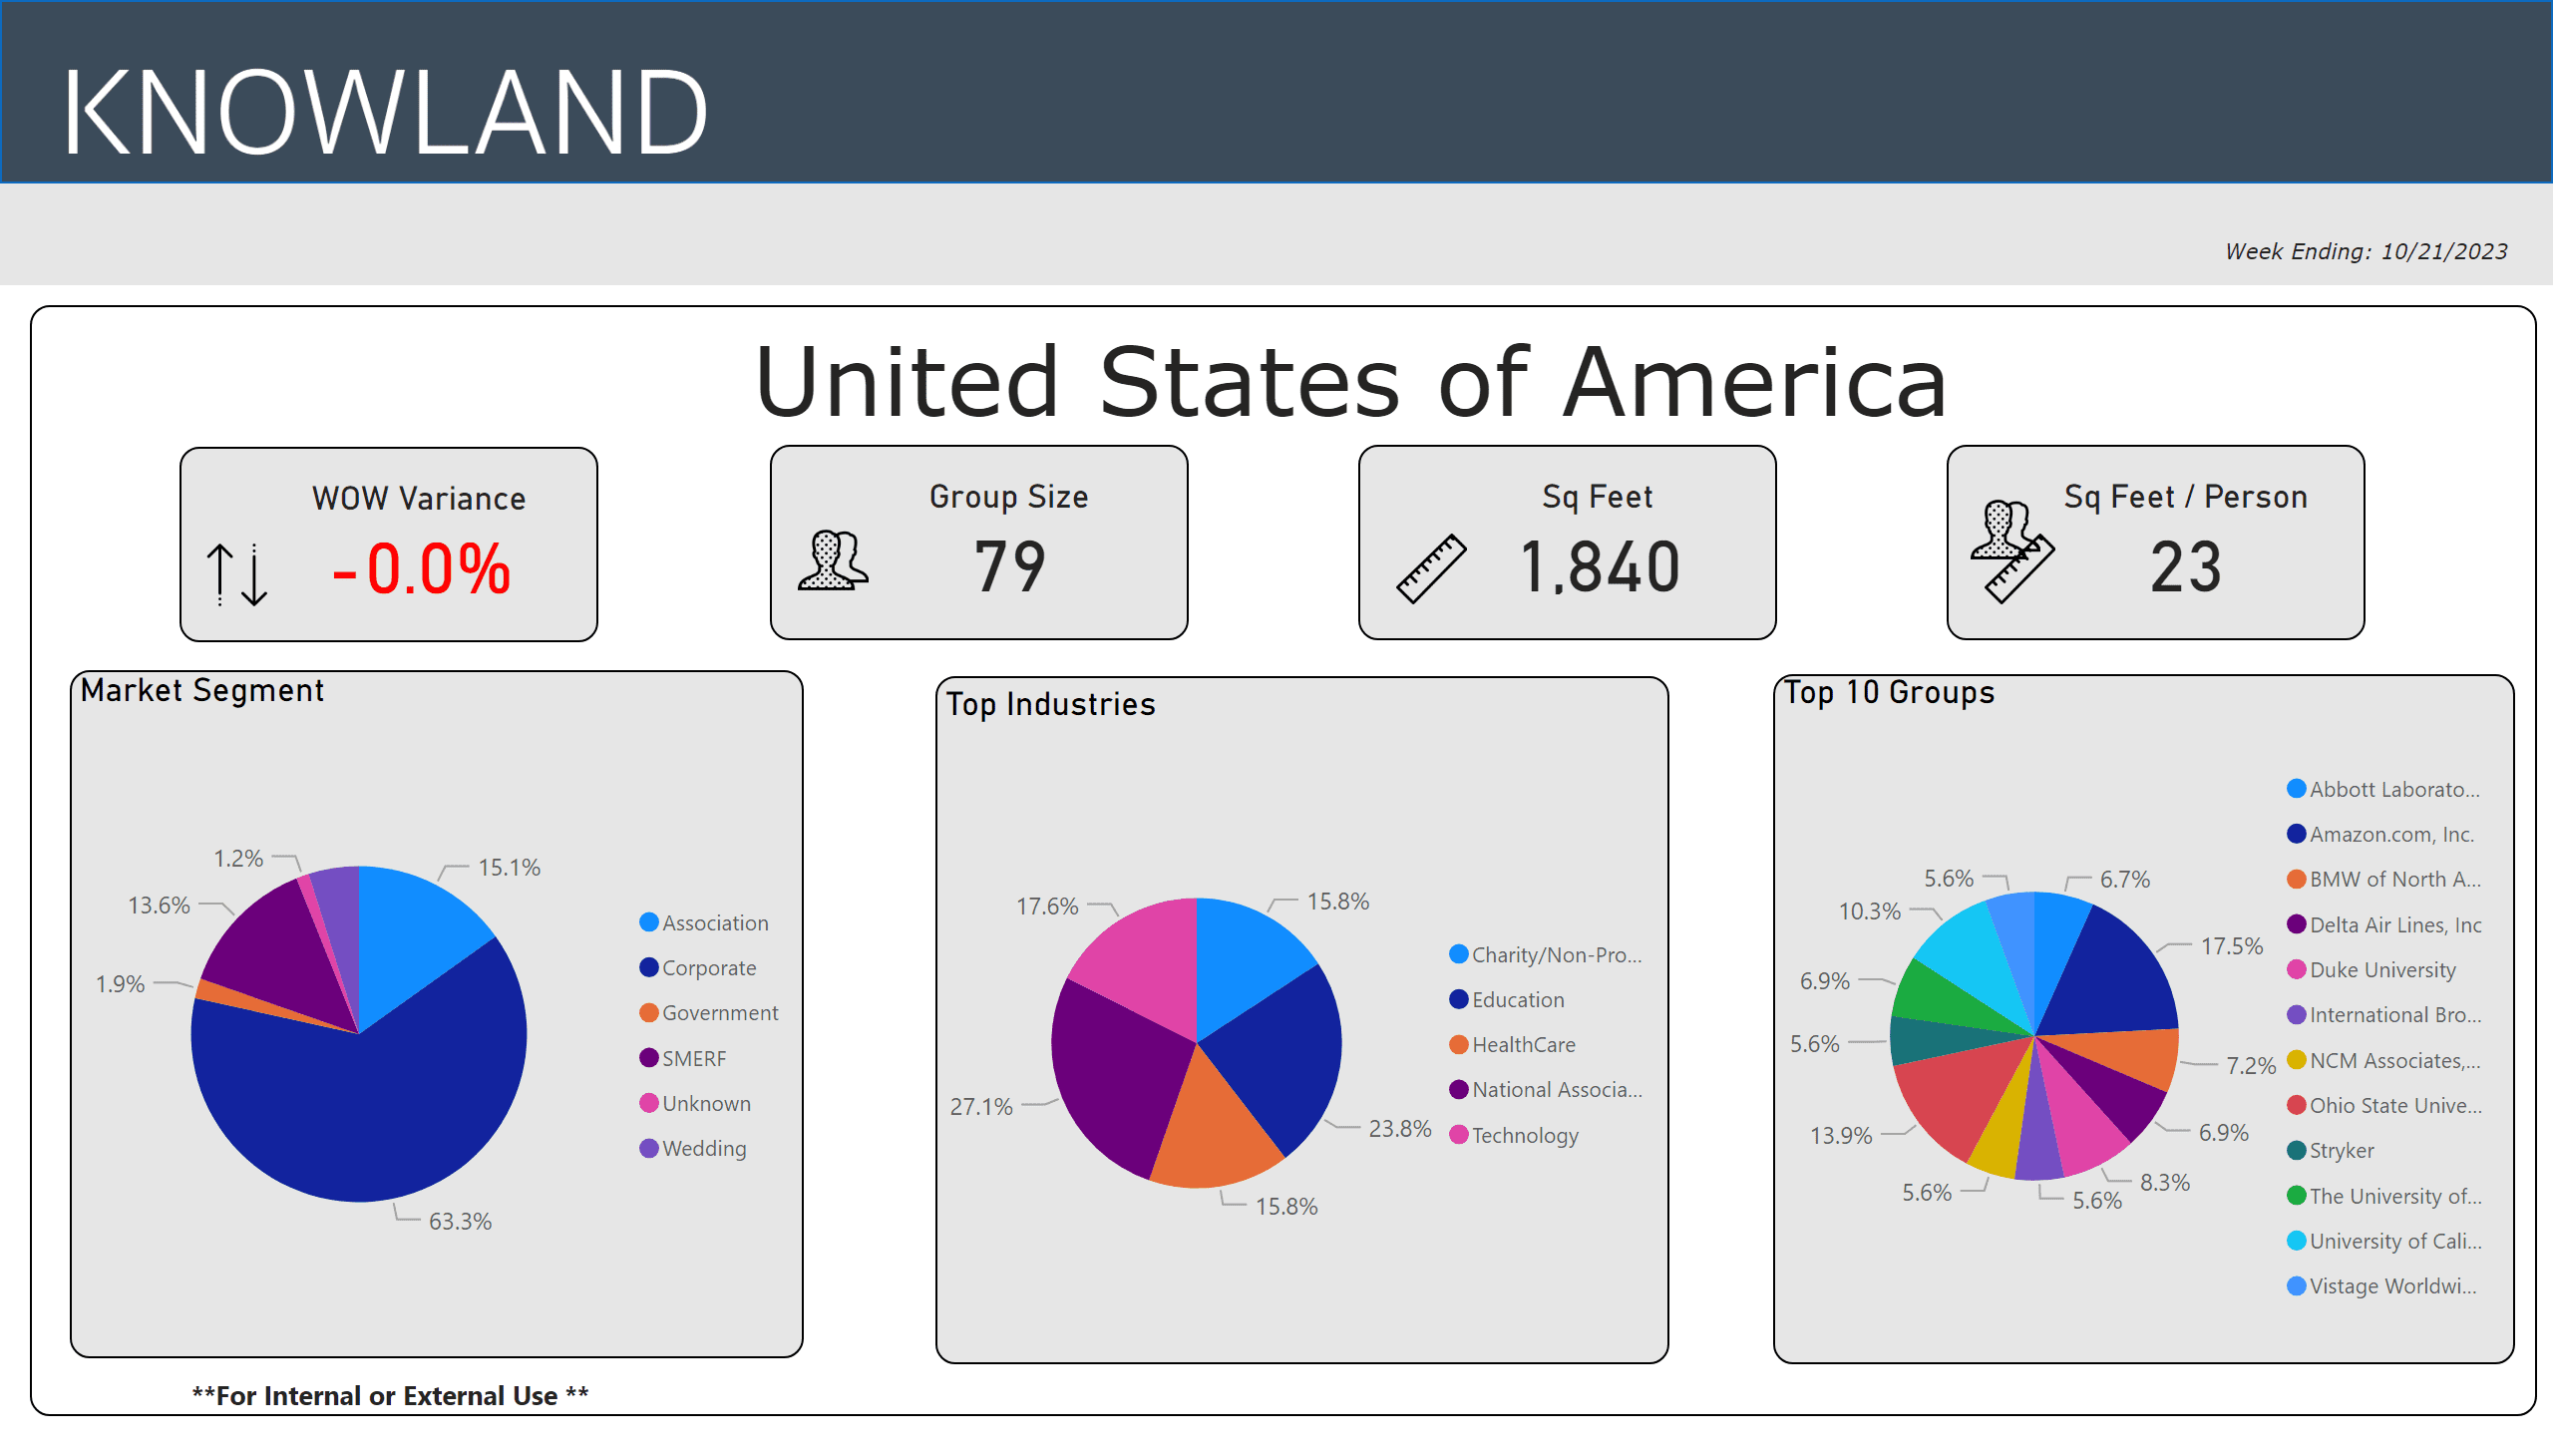
For the week ending October 28, 2023, the number of U.S. meetings and events increased 7.3% compared to the prior week. Washington DC leads in week-over-week growth with Las Vegas close behind at #2. Corporate events dominate share volume with 63.2% of meetings and events, with National Association driving the dominant industry share at 26.6% for the week, followed by the Education segment at 23.4%, for the top five segments.

The average number of attendees for the week was 87 ( compared to 79 for the previous week), while the average square footage used was 2,000 per event (compared to 1,840 for the previous week), and square feet used per person remained at 23.

10-28-23 hot trends

The top five segments for the week were: National Association, Education, Technology, Charity/Non-Profit/Social Services and Healthcare.

The full list of top growth market movers and shakers were: Washington DC-MD-VA, Las Vegas, NV, Boston, MA, Baltimore, MD and Miami-Hialeah, FL.

Market Average Group Size Average Sq Ft Used
Washington DC-_MD-VA 88 2,037
Las Vegas, NV 99 2,749
Boston, MA 71 1,614
Baltimore, MD 80 1,399
Miami-Hialeah, FL 87 2,216

These numbers and markets change weekly based on market dynamics and social trends.

Knowland tracks the weekly event activity across 166 U.S. markets with more globally and is expanding coverage regularly.

Talk to a Knowland data expert today for sneak peek at your market trends.

Category iconHot Data Trends Tag iconLas Vegas Meeting Trends,  Meetings and Events Stats,  Washington DC Meeting Trends,  Weekly Group Business Trends

Primary Sidebar

Footer

  • Solutions
    • Hotel Properties
    • Above Property Management
    •   – Portfolio Capture
    •   – Market Analytics
    • CVBs and DMOs
    • Features & Pricing
    • Certifications
    • Try for Free >
    • Demo Request >
  • Resources
    • Hospitality Group & Business Performance Index
    • Success Stories
    • White Papers & Datasheets
    • Webcasts & Events
    • Blog
    • Sales Calculator
    • Glossary
  • Customers
    • Customer Sign In >
    • Support & Training
    • Billing Inquiries >
  • About Us
    • Meet Knowland
    • Culture
    • Job Openings
    • Press & Media
    • Sustainability
    • Contact Us >

info@knowland.com

clientcare@knowland.com

202-312-5880

2300 Wilson Blvd. Ste 700 Arlington, VA 22201

Subscribe for news and updates

© 2004–2023 Knowland Group

Privacy Policy

Cookie Settings