• Skip to primary navigation
  • Skip to main content
  • Skip to primary sidebar
  • Skip to footer
Knowland

Knowland

  • Solutions
    • Hotel Properties
      • Knowland Classic
      • Knowland Select
    • Above Property Management
      • Portfolio Capture
      • Market Analytics
    • CVBs and DMOs
    • Features & Pricing
  • Resources
    • Hospitality Group & Business Performance Index
    • Success Stories
    • White Papers & Datasheets
    • Webcasts & Events
    • Blog
    • Sales Calculator
    • Glossary
  • Customers
    • Customer Sign In >
    • Support & Training
    • Billing Inquiries >
  • About Us
    • Meet Knowland
    • Culture
    • Job Openings
    • Press & Media
    • Sustainability
    • Contact Us
  • Support
  • Sign In
  • Try for Free
  • Request a Demo
  • Support
  • Sign In >
TRY FOR FREE REQUEST DEMO

Weekly Group Meetings and Events Stats, Week Ending August 10, 2024

August 13, 2024

Summer keeps steady with events, Portland leading in growth

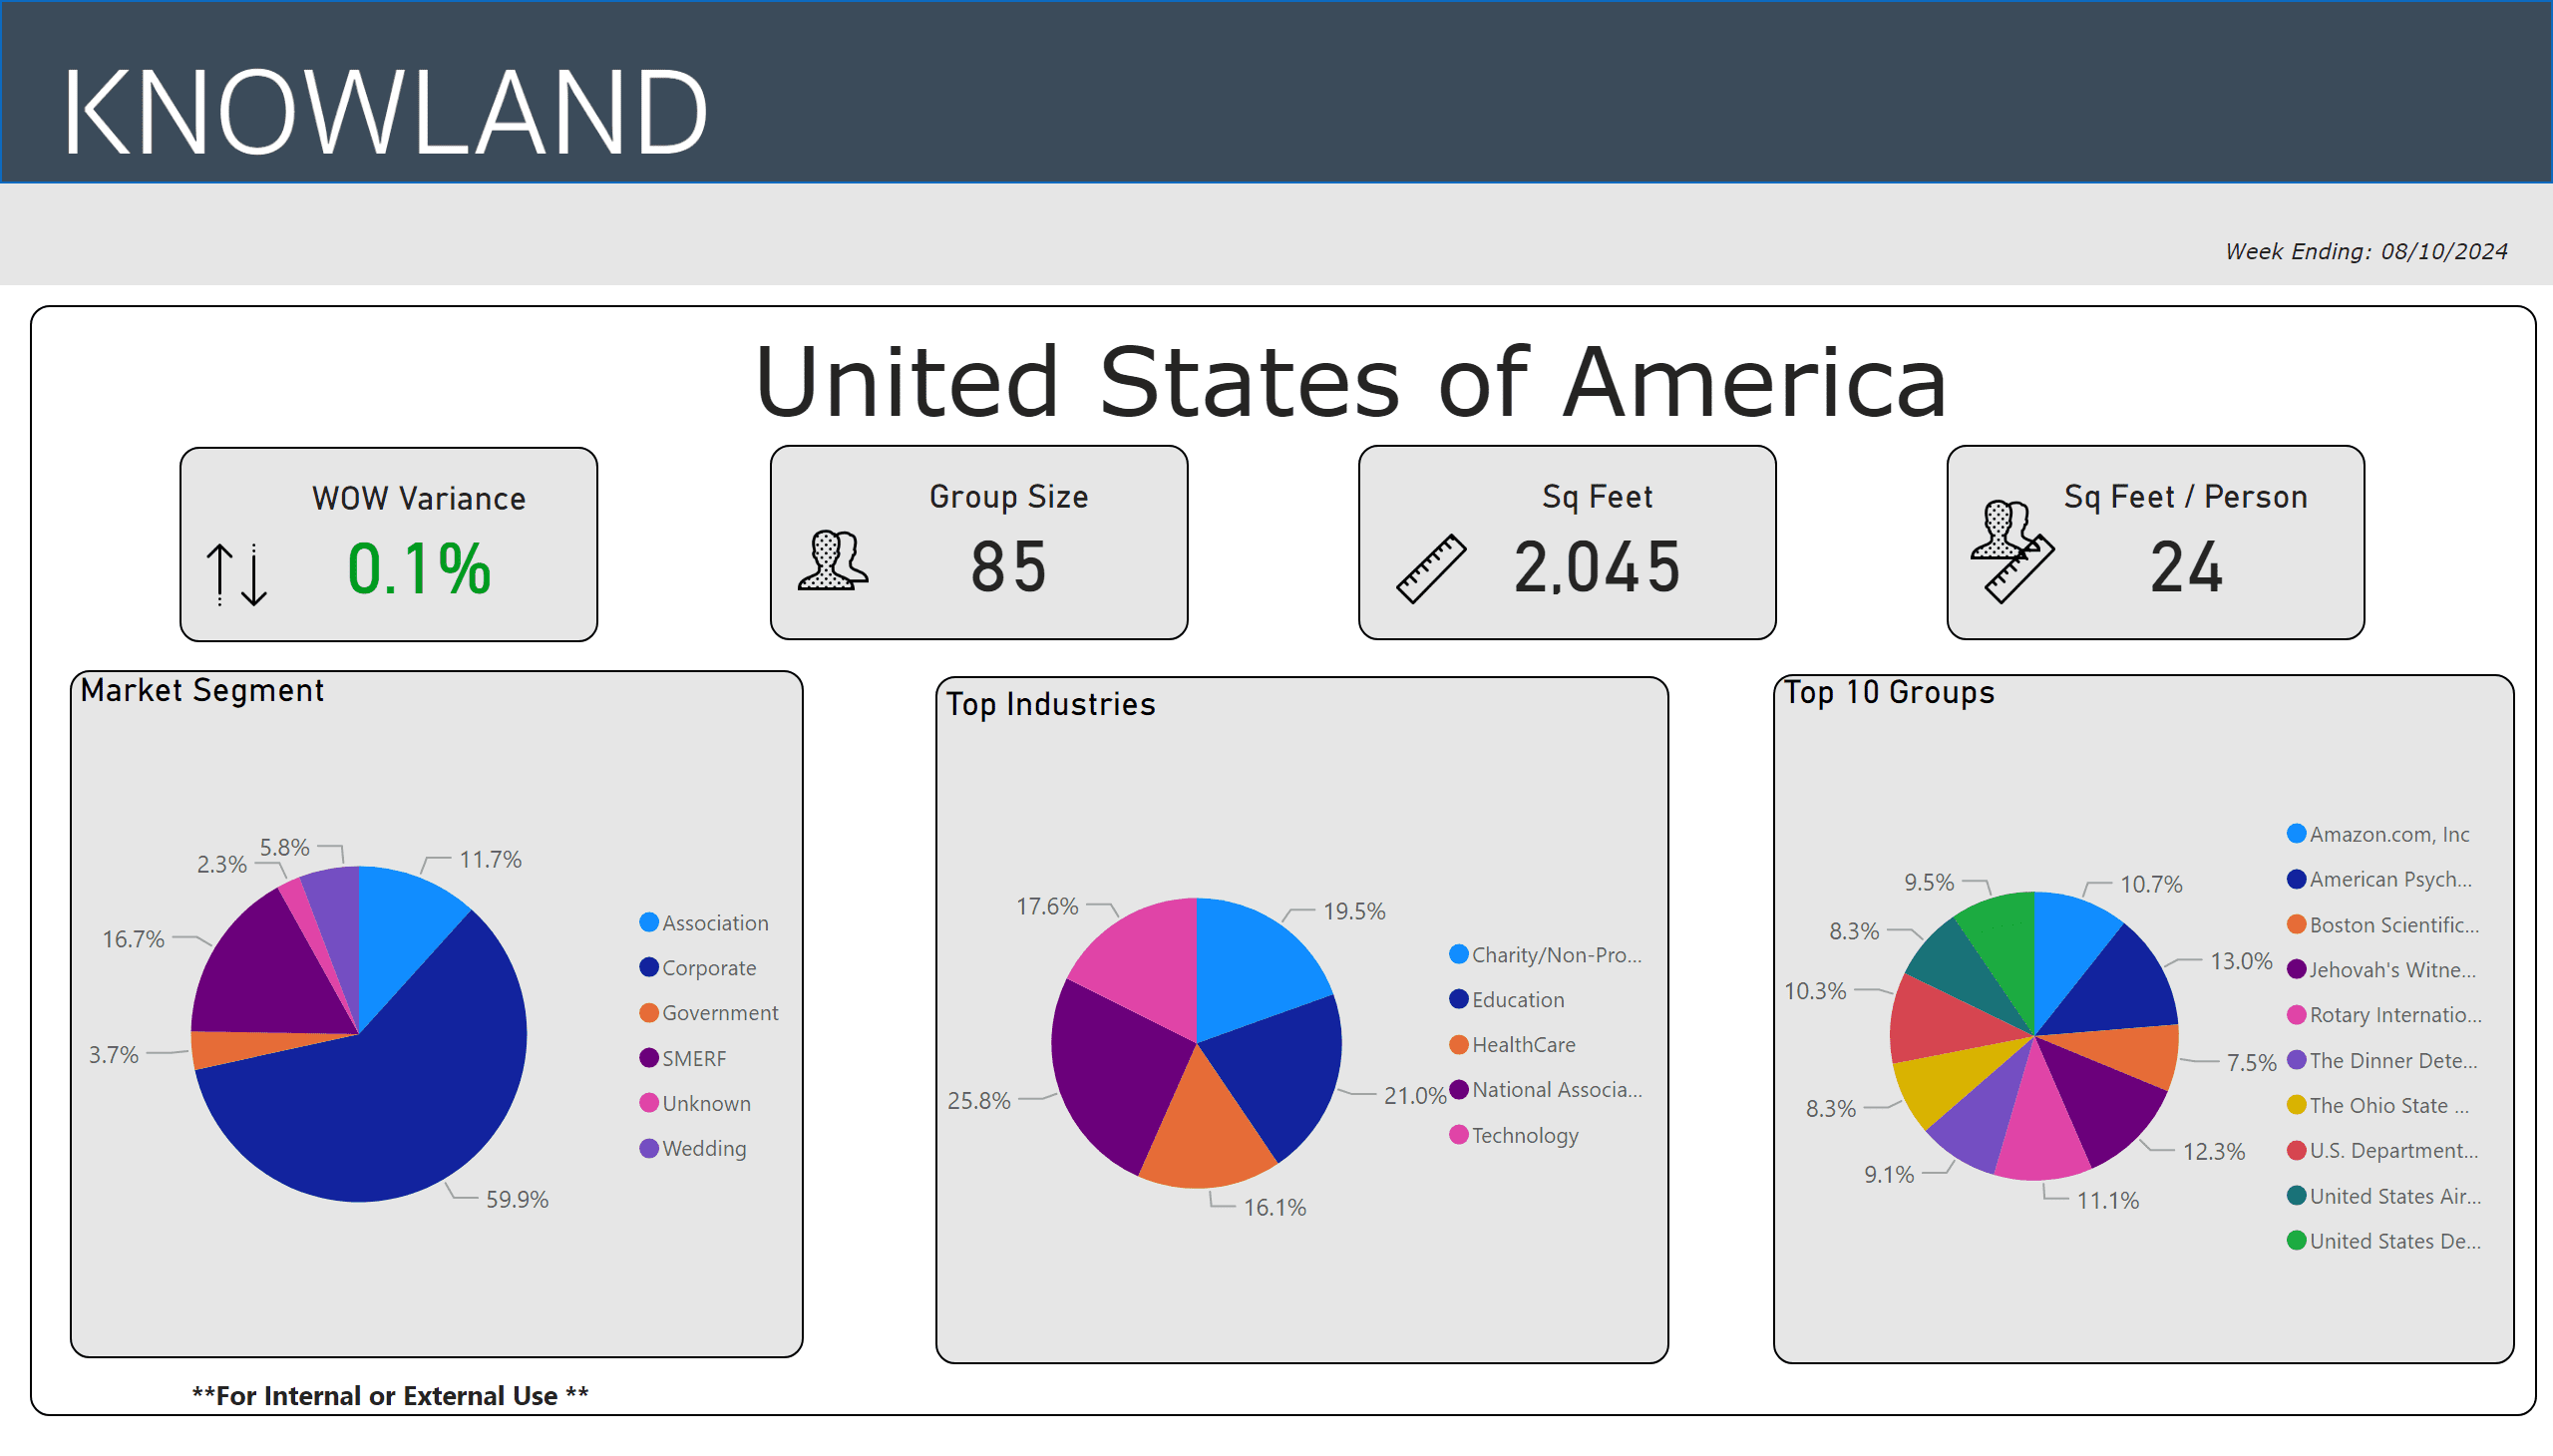
For the week ending August 10, 2024, the growth of U.S. meetings and events was flat compared to the previous week. Lazy days of summer show event volume steady this week. Corporate events share volume was 59.9%, with National Association and Education segments leading growth with 25.8% and 21.0% share respectively, of the top five segments. At 65%, Portland, OR showed the largest week over week growth of the top 5 “mover and shaker” markets.

The average number of attendees for the week was 85, while the average square footage used was 2,045 per event, and square feet used per person was 24.

Week of 8-10-24

The top five segments for the week were: National Association, Education, Charity/Non-Profit/Social Services, Technology and Healthcare.

The full list of top growth market movers and shakers were: Portland, Ft. Worth-Arlington, Houston, San Diego, Columbus and Kansas City for the largest week over week volume change.

Market Avg Group Size Avg Space Used Sq Ft
Portland, OR 114 2,080
Ft Worth-Arlington, TX 163 3,598
Houston, TX 92 1,950
San Diego, CA 102 2,600
Columbus, OH – tied 88 2,298
Kansas City, MO-KS – tied 109 2,880

These numbers and markets change weekly based on market dynamics and social trends.

Knowland tracks the weekly event activity across 166 U.S. markets with more globally and is expanding coverage regularly.

Talk to a Knowland data expert today for sneak peek at your market trends

Category iconHot Data Trends Tag icon2024 Meeting Trends,  Portland Events,  Weekly Group Business Trends

Primary Sidebar

Footer

  • Solutions
    • Hotel Properties
    •   – Knowland Classic
    •   – Knowland Select
    • Above Property Management
    •   – Portfolio Capture
    •   – Market Analytics
    • CVBs and DMOs
    • Features & Pricing
    • Try for Free >
    • Demo Request >
  • Resources
    • Hospitality Group & Business Performance Index
    • Success Stories
    • White Papers & Datasheets
    • Webcasts & Events
    • Blog
    • Sales Calculator
    • Glossary
  • Customers
    • Customer Sign In >
    • Support & Training
    • Billing Inquiries >
  • About Us
    • Meet Knowland
    • Culture
    • Job Openings
    • Press & Media
    • Sustainability
    • Contact Us >

[email protected]

[email protected]

202-312-5880

2300 Wilson Blvd. Ste 700 Arlington, VA 22201

Subscribe for news and updates

© 2004–2025 Knowland Group

Privacy Policy

Cookie Settings