• Skip to primary navigation
  • Skip to main content
  • Skip to primary sidebar
  • Skip to footer
Knowland

Knowland

  • Solutions
    • Hotel Properties
      • Knowland Classic
      • Knowland Select
    • Above Property Management
      • Portfolio Capture
      • Market Analytics
    • CVBs and DMOs
    • Features & Pricing
  • Resources
    • Hospitality Group & Business Performance Index
    • Success Stories
    • White Papers & Datasheets
    • Webcasts & Events
    • Blog
    • Sales Calculator
    • Glossary
  • Customers
    • Customer Sign In >
    • Support & Training
    • Billing Inquiries >
  • About Us
    • Meet Knowland
    • Culture
    • Job Openings
    • Press & Media
    • Sustainability
    • Contact Us
  • Support
  • Sign In
  • Try for Free
  • Request a Demo
  • Support
  • Sign In >
TRY FOR FREE REQUEST DEMO

Weekly Group Meetings and Events Stats, Week Ending July 27, 2024

July 31, 2024

Secondary markets Austin, Portland and Indianapolis show top event growth for the week

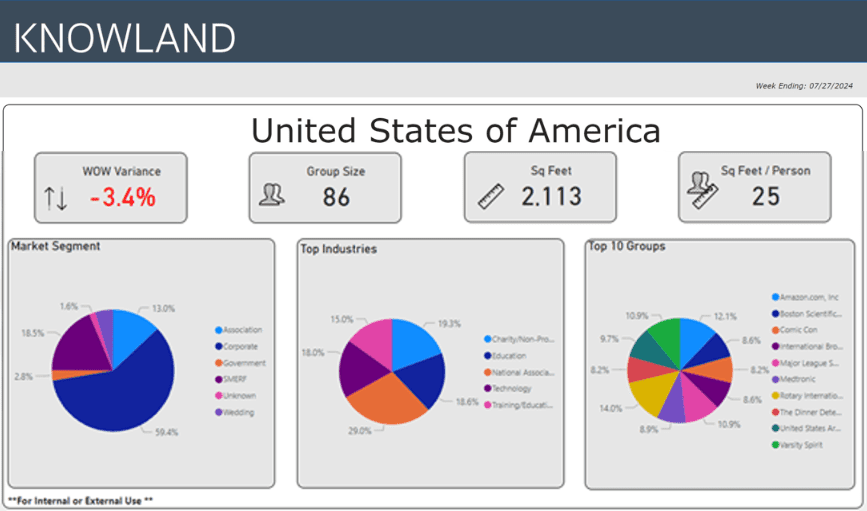
For the week ending July 27, 2024, the growth of U.S. meetings and events was down slightly by 3.4% compared to the previous week. Corporate events share volume was 59.4%, with National Association and Charity/Non-Profit/Social Services segments leading growth with 29.0% and 19.3% share respectively, of the top five segments. At 64%, Austin showed the largest week over week growth of the top 5 “mover and shaker” markets.

The average number of attendees for the week was 86, while the average square footage used was 2,113 per event, and square feet used per person remained at 25.

7-27-24 hot trends

The top five segments for the week were: National Association, Charity/Non-Profit/Social Services, Education, Technology and Training/Education.

The full list of top growth market movers and shakers were: Austin, Atlanta, Houston, Portland, and Indianapolis, for the largest week over week volume change.

Market Avg Group Size Avg Space Used Sq Ft
Austin, TX 66 1,696
Atlanta, GA 107 2,145
Houston, TX 72 1,777
Portland, OR 132 2,415
Indianapolis, IN 81 2,062

These numbers and markets change weekly based on market dynamics and social trends.

Knowland tracks the weekly event activity across 166 U.S. markets with more globally and is expanding coverage regularly.

Talk to a Knowland data expert today for sneak peek at your market trends

Category iconHot Data Trends Tag icon2024 Meeting Trends,  Austin events,  Indianapolis Events,  Portland Events,  Weekly Group Business Trends

Primary Sidebar

Footer

  • Solutions
    • Hotel Properties
    •   – Knowland Classic
    •   – Knowland Select
    • Above Property Management
    •   – Portfolio Capture
    •   – Market Analytics
    • CVBs and DMOs
    • Features & Pricing
    • Try for Free >
    • Demo Request >
  • Resources
    • Hospitality Group & Business Performance Index
    • Success Stories
    • White Papers & Datasheets
    • Webcasts & Events
    • Blog
    • Sales Calculator
    • Glossary
  • Customers
    • Customer Sign In >
    • Support & Training
    • Billing Inquiries >
  • About Us
    • Meet Knowland
    • Culture
    • Job Openings
    • Press & Media
    • Sustainability
    • Contact Us >

[email protected]

[email protected]

202-312-5880

2300 Wilson Blvd. Ste 700 Arlington, VA 22201

Subscribe for news and updates

© 2004–2025 Knowland Group

Privacy Policy

Cookie Settings