• Skip to primary navigation
  • Skip to main content
  • Skip to primary sidebar
  • Skip to footer
Knowland

Knowland

  • Solutions
    • Hotel Properties
      • Knowland Classic
      • Knowland Select
    • Above Property Management
      • Portfolio Capture
      • Market Analytics
    • CVBs and DMOs
    • Features & Pricing
  • Resources
    • Hospitality Group & Business Performance Index
    • Success Stories
    • White Papers & Datasheets
    • Webcasts & Events
    • Blog
    • Sales Calculator
    • Glossary
  • Customers
    • Customer Sign In >
    • Support & Training
    • Billing Inquiries >
  • About Us
    • Meet Knowland
    • Culture
    • Job Openings
    • Press & Media
    • Sustainability
    • Contact Us
  • Support
  • Sign In
  • Try for Free
  • Request a Demo
  • Support
  • Sign In >
TRY FOR FREE REQUEST DEMO

New York Turns Up: Top 5 Growth Markets for Meetings & Events (Week Ending September 28, 2024)

October 2, 2024

City that never sleeps leads meetings and events growth

While overall meeting growth was flat compared to the previous week, several key markets are experiencing significant growth. New York City was a standout. Let’s dive into the data and explore the top 5 growth markets according to Knowland data for the week ending September 28, 2024.

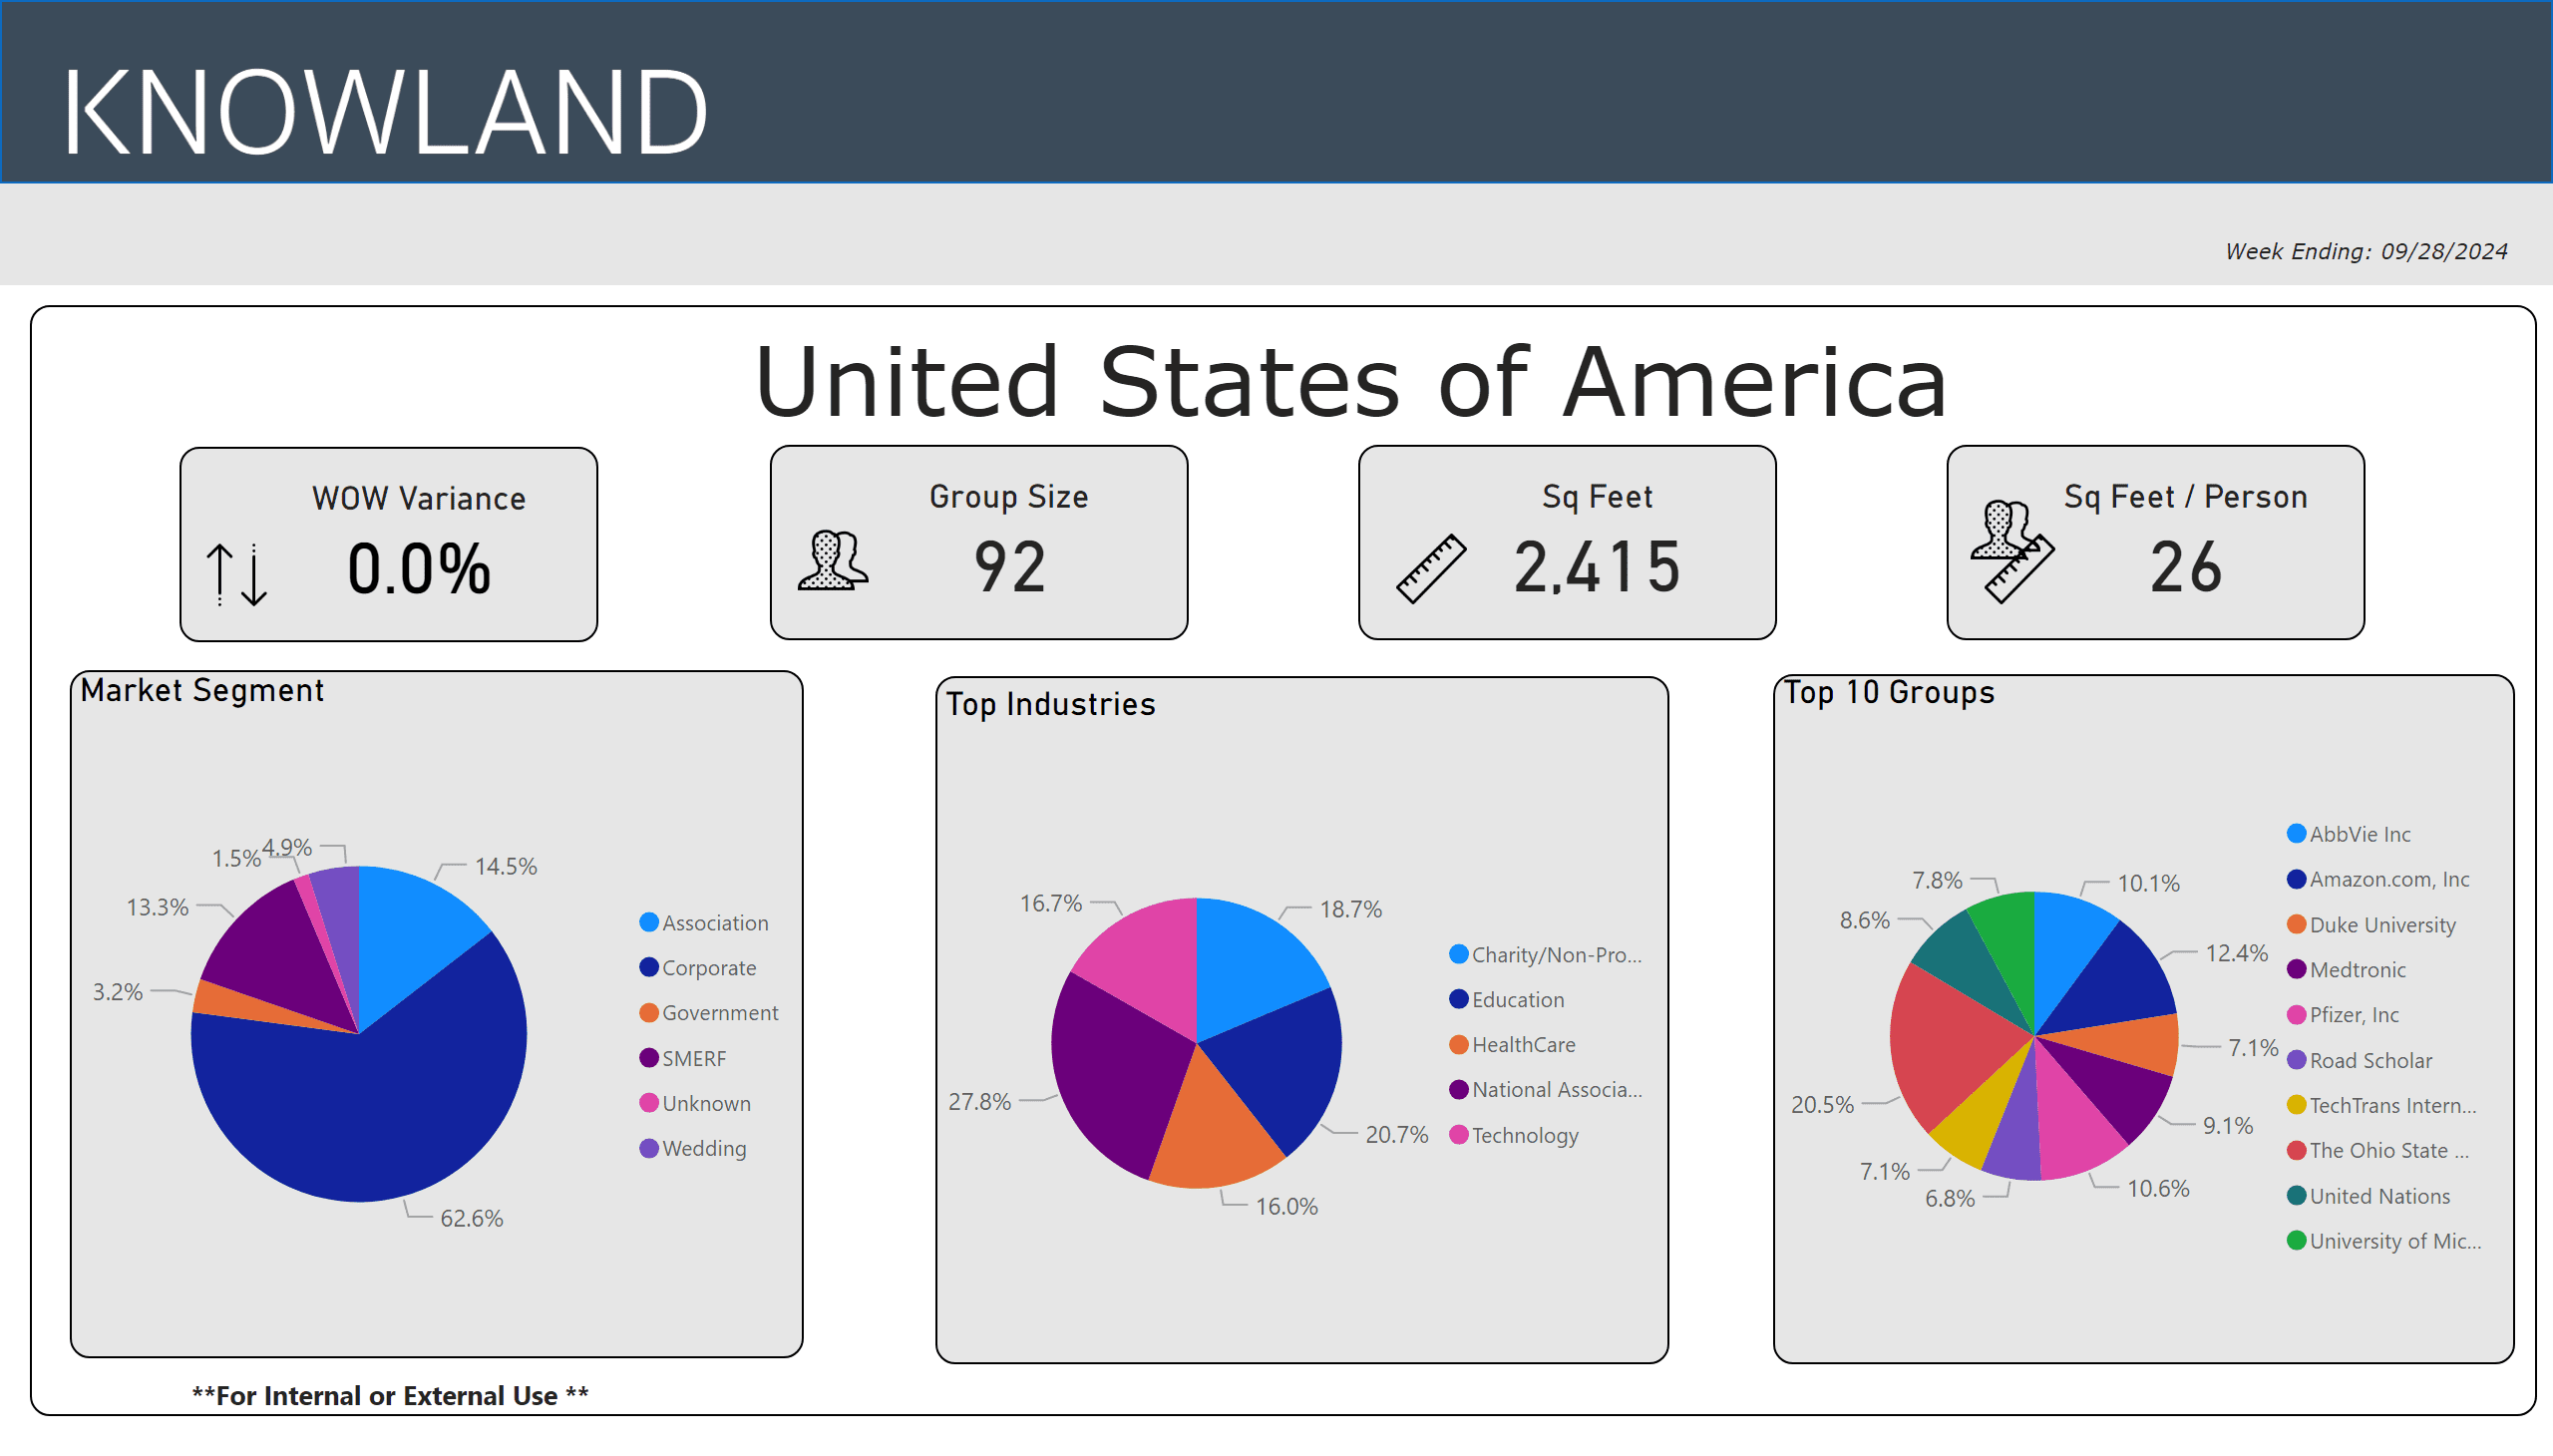
The U.S. meetings and events volume was steady compared to the previous week. Corporate events share volume was 62.6%, with National Association and Education segments leading growth with 27.8% and 20.7% share respectively, of the top five segments. At 124%, New York showed the largest growth week over week of the top 5 “mover and shaker” markets.

The average number of attendees for the week was 92, while the average square footage used was 2,415 per event, and square feet used per person was 26.

Data trends for 9-28-24

The top five segments for the week were: National Association, Education, Charity/Non-Profit/Social Services, Technology, and Healthcare.

The full list of top growth market movers and shakers were: Chicago, Orlando, Salt Lake City, Atlanta and Washington DC, for the largest week over week volume change.

Market Avg Group Size Avg Space Used Sq Ft
New York, NY 52 1,149
Washington DC-MD-VA 91 2,500
San Diego, CA 115 4,154
Austin, TX 91 2,557
San Antonio, TX 85 2,680

These numbers and markets change weekly based on market dynamics and social trends.

Knowland tracks the weekly event activity across 166 U.S. markets with more globally and is expanding coverage regularly.

Talk to a Knowland data expert today for sneak peek at your market trends

Category iconHot Data Trends Tag icon2024 Meeting Trends,  New York Meeting Trends,  Weekly Group Business Trends

Primary Sidebar

Footer

  • Solutions
    • Hotel Properties
    •   – Knowland Classic
    •   – Knowland Select
    • Above Property Management
    •   – Portfolio Capture
    •   – Market Analytics
    • CVBs and DMOs
    • Features & Pricing
    • Try for Free >
    • Demo Request >
  • Resources
    • Hospitality Group & Business Performance Index
    • Success Stories
    • White Papers & Datasheets
    • Webcasts & Events
    • Blog
    • Sales Calculator
    • Glossary
  • Customers
    • Customer Sign In >
    • Support & Training
    • Billing Inquiries >
  • About Us
    • Meet Knowland
    • Culture
    • Job Openings
    • Press & Media
    • Sustainability
    • Contact Us >

[email protected]

[email protected]

202-312-5880

2300 Wilson Blvd. Ste 700 Arlington, VA 22201

Subscribe for news and updates

© 2004–2025 Knowland Group

Privacy Policy

Cookie Settings