• Skip to primary navigation
  • Skip to main content
  • Skip to primary sidebar
  • Skip to footer
Knowland

Knowland

  • Solutions
    • Hotel Properties
      • Knowland Classic
      • Knowland Select
    • Above Property Management
      • Portfolio Capture
      • Market Analytics
    • CVBs and DMOs
    • Features & Pricing
  • Resources
    • Hospitality Group & Business Performance Index
    • Success Stories
    • White Papers & Datasheets
    • Webcasts & Events
    • Blog
    • Sales Calculator
    • Glossary
  • Customers
    • Customer Sign In >
    • Support & Training
    • Billing Inquiries >
  • About Us
    • Meet Knowland
    • Culture
    • Job Openings
    • Press & Media
    • Sustainability
    • Contact Us
  • Support
  • Sign In
  • Try for Free
  • Request a Demo
  • Support
  • Sign In >
TRY FOR FREE REQUEST DEMO

Charlotte Breaks into the Top 5 Growth Markets for Meetings & Events (Week Ending October 5, 2024)

October 9, 2024

Charlotte, NC shows up in top 5 markets this week

While overall meeting growth decreased compared to the previous week, several Southern markets experienced significant growth, including Charlotte and Raleigh-Durham-Chapel Hill. Let’s dive into the data and explore the top 5 growth markets according to Cendyn, formerly Knowland, data for the week ending October, 2024.

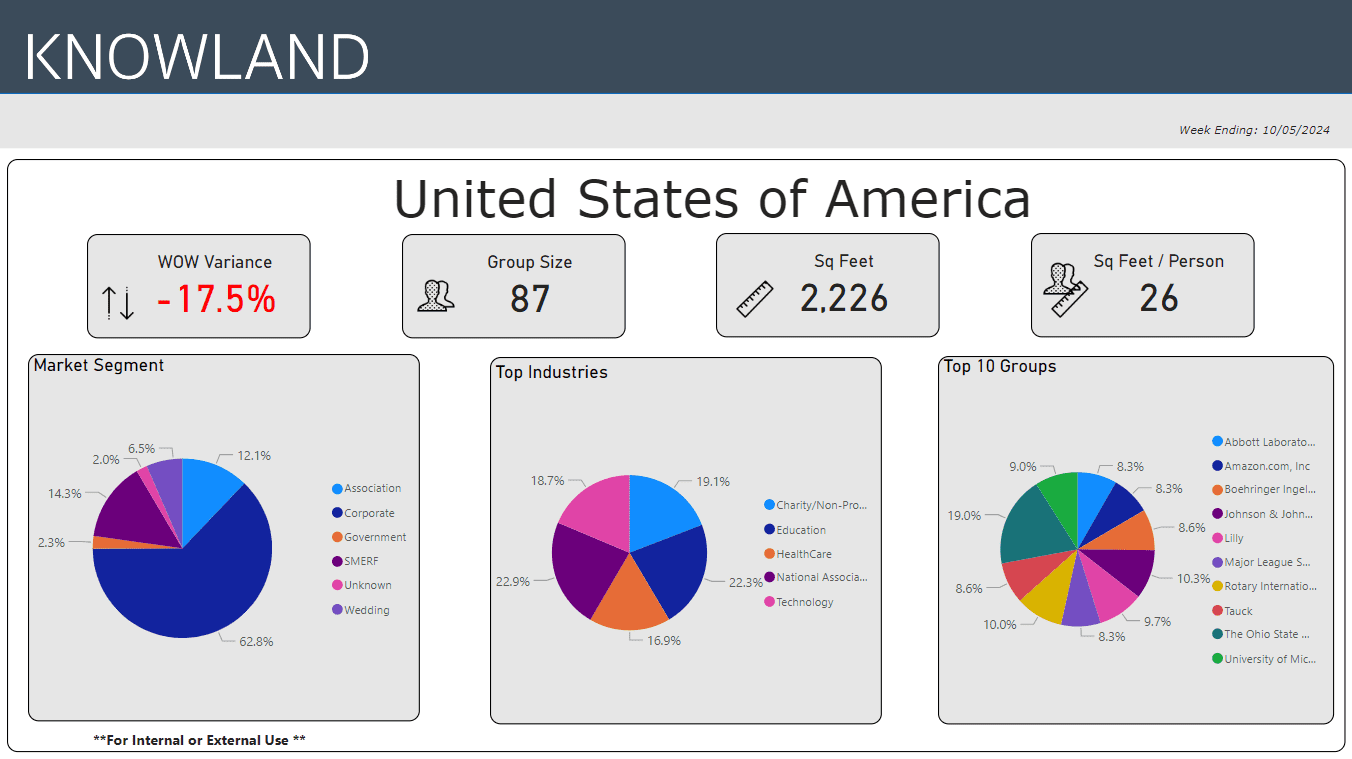
The U.S. meetings and events volume was down 17.5% compared to the previous week. Corporate events share volume was 62.8%, with National Association and Education segments leading growth with 22.9% and 22.3% share respectively, of the top five segments. At 54%, Las Vegas showed the largest growth week over week of the top 5 “mover and shaker” markets.

The average number of attendees for the week was 87, while the average square footage used was 2,226 per event, and square feet used per person was 26.

Weekly data

The top five segments for the week were: National Association, Education, Charity/Non-Profit/Social Services, Technology, and Healthcare.

The full list of top growth market movers and shakers were: Las Vegas, Charlotte, Central New Jersey, Raleigh-Durham-Chapel Hill and Pennsylvania South Central, for the largest week over week volume change.

Market Avg Group Size Avg Space Used Sq Ft
Las Vegas, NV 81 2,211
Charlotte, NC 89 1,941
Central New Jersey 83 1,722
Raleigh-Durham-Chapel Hill, NC 86 1,950
Pennsylvania South Central 319 5,109

These numbers and markets change weekly based on market dynamics and social trends.

Cendyn, formerly Knowland, tracks the weekly event activity across 166 U.S. markets with more globally and is expanding coverage regularly.

Talk to a data expert today for sneak peek at your market trends

Category iconHot Data Trends Tag icon2024 Meeting Trends,  New York Meeting Trends,  Weekly Group Business Trends

Primary Sidebar

Footer

  • Solutions
    • Hotel Properties
    •   – Knowland Classic
    •   – Knowland Select
    • Above Property Management
    •   – Portfolio Capture
    •   – Market Analytics
    • CVBs and DMOs
    • Features & Pricing
    • Try for Free >
    • Demo Request >
  • Resources
    • Hospitality Group & Business Performance Index
    • Success Stories
    • White Papers & Datasheets
    • Webcasts & Events
    • Blog
    • Sales Calculator
    • Glossary
  • Customers
    • Customer Sign In >
    • Support & Training
    • Billing Inquiries >
  • About Us
    • Meet Knowland
    • Culture
    • Job Openings
    • Press & Media
    • Sustainability
    • Contact Us >

[email protected]

[email protected]

202-312-5880

2300 Wilson Blvd. Ste 700 Arlington, VA 22201

Subscribe for news and updates

© 2004–2025 Knowland Group

Privacy Policy

Cookie Settings