• Skip to primary navigation
  • Skip to main content
  • Skip to primary sidebar
  • Skip to footer
Knowland

Knowland

  • Solutions
    • Hotel Properties
      • Knowland Classic
      • Knowland Select
    • Above Property Management
      • Portfolio Capture
      • Market Analytics
    • CVBs and DMOs
    • Features & Pricing
  • Resources
    • Hospitality Group & Business Performance Index
    • Success Stories
    • White Papers & Datasheets
    • Webcasts & Events
    • Blog
    • Sales Calculator
    • Glossary
  • Customers
    • Customer Sign In >
    • Support & Training
    • Billing Inquiries >
  • About Us
    • Meet Knowland
    • Culture
    • Job Openings
    • Press & Media
    • Sustainability
    • Contact Us
  • Support
  • Sign In
  • Try for Free
  • Request a Demo
  • Support
  • Sign In >
TRY FOR FREE REQUEST DEMO

Weekly Group Meetings and Events Stats, Week Ending August 31, 2024

September 2, 2024

New York delivers top event growth as market slows for end of Summer

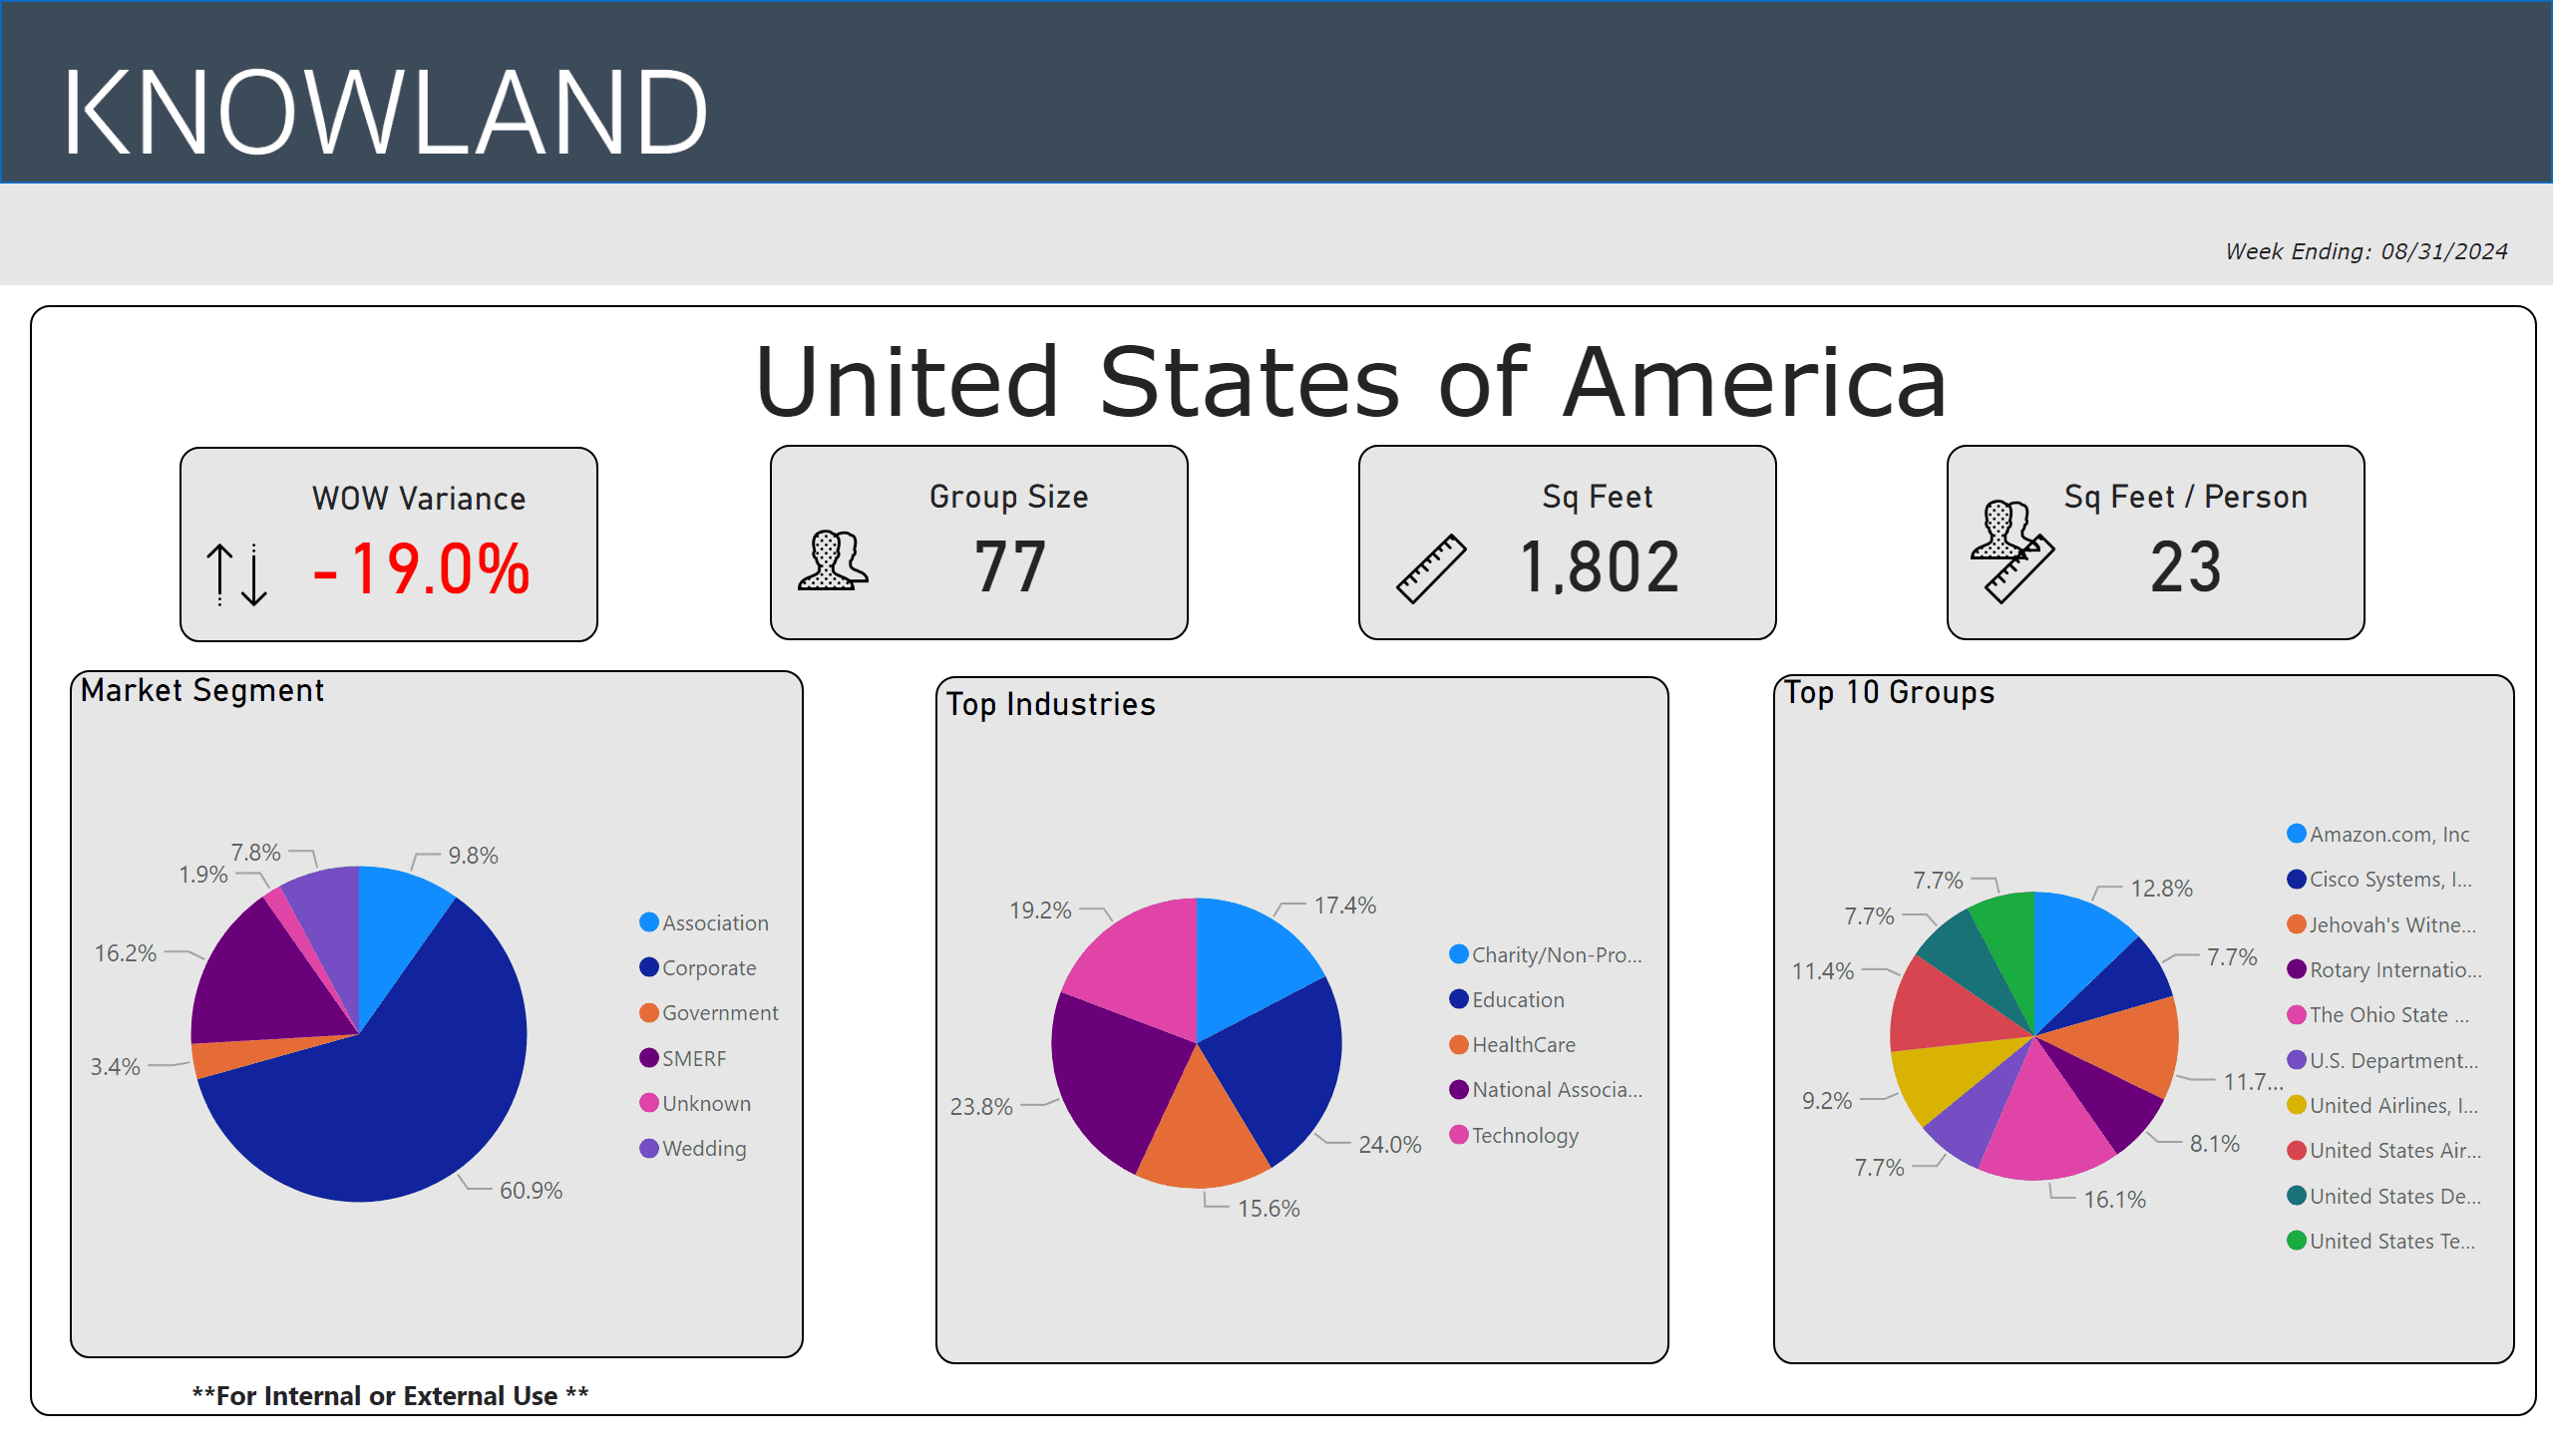
For the week ending August 31, 2024, the U.S. meetings and events volume was down 19% compared to the previous week. Event volume slowed as the final weeks of summer focused on family activities and back to school preparations. Corporate events share volume was 60.9%, with Education and National Association segments leading growth with 24.0% and 23.8% share respectively, of the top five segments. At 38%, New York, NY showed the largest week over week growth of the top 5 “mover and shaker” markets.

The average number of attendees for the week was 77, while the average square footage used was 1,802 per event, and square feet used per person was 23.

8-31-24 hot trends

The top five segments for the week were: Education, National Association, Technology, Charity/Non-Profit/Social Services, and Healthcare.

The full list of top growth market movers and shakers were: New York, Des Moines, Myrtle Beach, Indiana North, and Texas West, for the largest week over week volume change.

Market Avg Group Size Avg Space Used Sq Ft
New York, NY 67 1,320
Des Moines, IA 75 1,470
Myrtle Beach, SC 161 3,350
Indiana, North 401 6,422
Texas West 59 1,425

These numbers and markets change weekly based on market dynamics and social trends.

Knowland tracks the weekly event activity across 166 U.S. markets with more globally and is expanding coverage regularly.

Talk to a Knowland data expert today for sneak peek at your market trends

Category iconHot Data Trends Tag icon2024 Meeting Trends,  New York Meeting Trends,  Weekly Group Business Trends

Primary Sidebar

Footer

  • Solutions
    • Hotel Properties
    •   – Knowland Classic
    •   – Knowland Select
    • Above Property Management
    •   – Portfolio Capture
    •   – Market Analytics
    • CVBs and DMOs
    • Features & Pricing
    • Try for Free >
    • Demo Request >
  • Resources
    • Hospitality Group & Business Performance Index
    • Success Stories
    • White Papers & Datasheets
    • Webcasts & Events
    • Blog
    • Sales Calculator
    • Glossary
  • Customers
    • Customer Sign In >
    • Support & Training
    • Billing Inquiries >
  • About Us
    • Meet Knowland
    • Culture
    • Job Openings
    • Press & Media
    • Sustainability
    • Contact Us >

[email protected]

[email protected]

202-312-5880

2300 Wilson Blvd. Ste 700 Arlington, VA 22201

Subscribe for news and updates

© 2004–2025 Knowland Group

Privacy Policy

Cookie Settings