• Skip to primary navigation
  • Skip to main content
  • Skip to primary sidebar
  • Skip to footer
Knowland

Knowland

  • Solutions
    • Hotel Properties
      • Knowland Classic
      • Knowland Select
    • Above Property Management
      • Portfolio Capture
      • Market Analytics
    • CVBs and DMOs
    • Features & Pricing
  • Resources
    • Hospitality Group & Business Performance Index
    • Success Stories
    • White Papers & Datasheets
    • Webcasts & Events
    • Blog
    • Sales Calculator
    • Glossary
  • Customers
    • Customer Sign In >
    • Support & Training
    • Billing Inquiries >
  • About Us
    • Meet Knowland
    • Culture
    • Job Openings
    • Press & Media
    • Sustainability
    • Contact Us
  • Support
  • Sign In
  • Try for Free
  • Request a Demo
  • Support
  • Sign In >
TRY FOR FREE REQUEST DEMO

Weekly Group Meetings and Events Stats, Week Ending September 7, 2024

September 11, 2024

San Diego leads top market growth for the week at 42% week-over-week

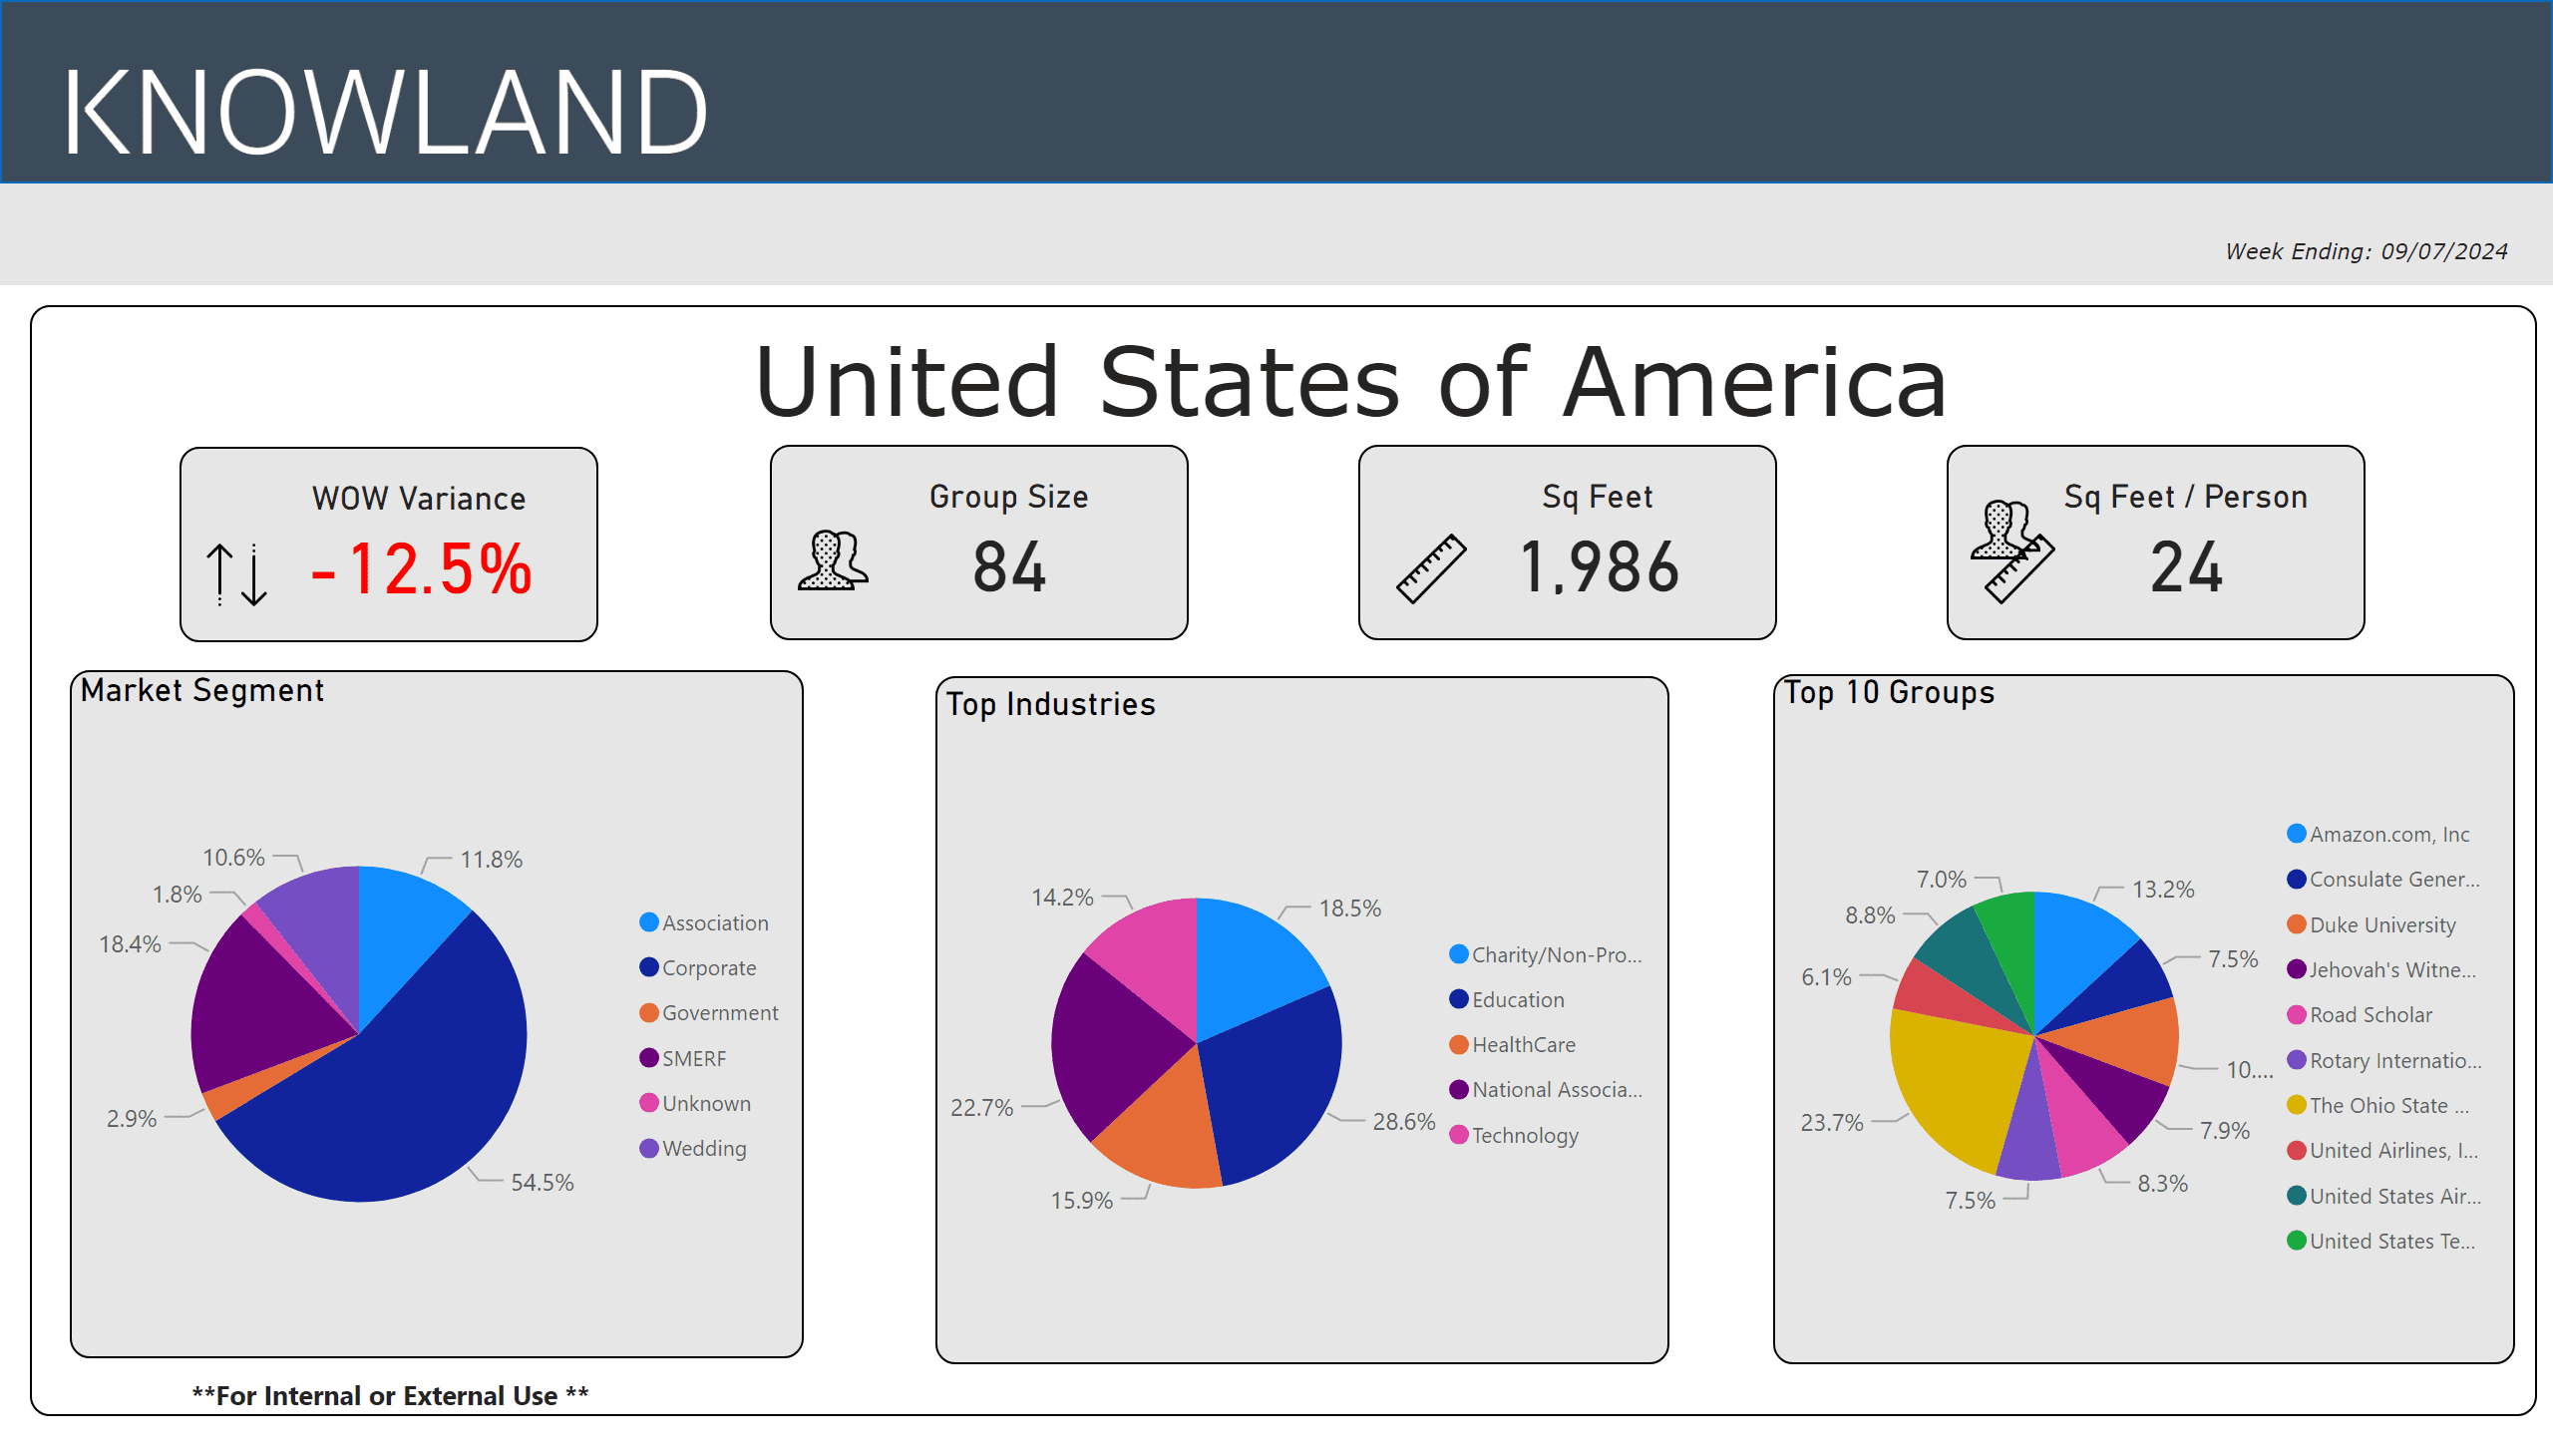
For the week ending September 7, 2024, the U.S. meetings and events volume was down 12.5% compared to the previous week. Corporate events share volume was 54.5%, with Education and National Association segments leading growth with 28.6% and 22.7% share respectively, of the top five segments. At 42%, San Diego showed the largest week over week growth of the top 5 “mover and shaker” markets.

The average number of attendees for the week was 84, while the average square footage used was 1,986 per event, and square feet used per person was 24.

Hot trends 9-7-24

The top five segments for the week were: Education, National Association, Charity/Non-Profit/Social Services, Healthcare, and Technology.

The full list of top growth market movers and shakers were: San Diego, Anaheim-Santa Ana, California Central Coast, Harrisburg. Michigan South and Salt Lake City (tied for fifth market), for the largest week over week volume change.

Market Avg Group Size Avg Space Used Sq Ft
San Diego, CA 117 2,688
Anaheim-Santa Ana, CA 106 2,583
California Central Coast 112 2,400
Harrisburg, PA 53 1,591
Michigan South (tied) 78 1,443
Salt Lake City-Ogden, UT (tied) 100 3,115

These numbers and markets change weekly based on market dynamics and social trends.

Knowland tracks the weekly event activity across 166 U.S. markets with more globally and is expanding coverage regularly.

Talk to a Knowland data expert today for sneak peek at your market trends

Category iconHot Data Trends Tag icon2024 Meeting Trends,  San Diego Meeting Trends,  Weekly Group Business Trends

Primary Sidebar

Footer

  • Solutions
    • Hotel Properties
    •   – Knowland Classic
    •   – Knowland Select
    • Above Property Management
    •   – Portfolio Capture
    •   – Market Analytics
    • CVBs and DMOs
    • Features & Pricing
    • Try for Free >
    • Demo Request >
  • Resources
    • Hospitality Group & Business Performance Index
    • Success Stories
    • White Papers & Datasheets
    • Webcasts & Events
    • Blog
    • Sales Calculator
    • Glossary
  • Customers
    • Customer Sign In >
    • Support & Training
    • Billing Inquiries >
  • About Us
    • Meet Knowland
    • Culture
    • Job Openings
    • Press & Media
    • Sustainability
    • Contact Us >

[email protected]

[email protected]

202-312-5880

2300 Wilson Blvd. Ste 700 Arlington, VA 22201

Subscribe for news and updates

© 2004–2025 Knowland Group

Privacy Policy

Cookie Settings