• Skip to primary navigation
  • Skip to main content
  • Skip to primary sidebar
  • Skip to footer
Knowland

Knowland

  • Solutions
    • Hotel Properties
      • Knowland Classic
      • Knowland Select
    • Above Property Management
      • Portfolio Capture
      • Market Analytics
    • CVBs and DMOs
    • Features & Pricing
  • Resources
    • Hospitality Group & Business Performance Index
    • Success Stories
    • White Papers & Datasheets
    • Webcasts & Events
    • Blog
    • Sales Calculator
    • Glossary
  • Customers
    • Customer Sign In >
    • Support & Training
    • Billing Inquiries >
  • About Us
    • Meet Knowland
    • Culture
    • Job Openings
    • Press & Media
    • Sustainability
    • Contact Us
  • Support
  • Sign In
  • Try for Free
  • Request a Demo
  • Support
  • Sign In >
TRY FOR FREE REQUEST DEMO

Weekly Group Meetings and Events Stats, Week Ending September 14, 2024

September 18, 2024

Washington DC attracts more groups with nearly 5x volume growth for the week

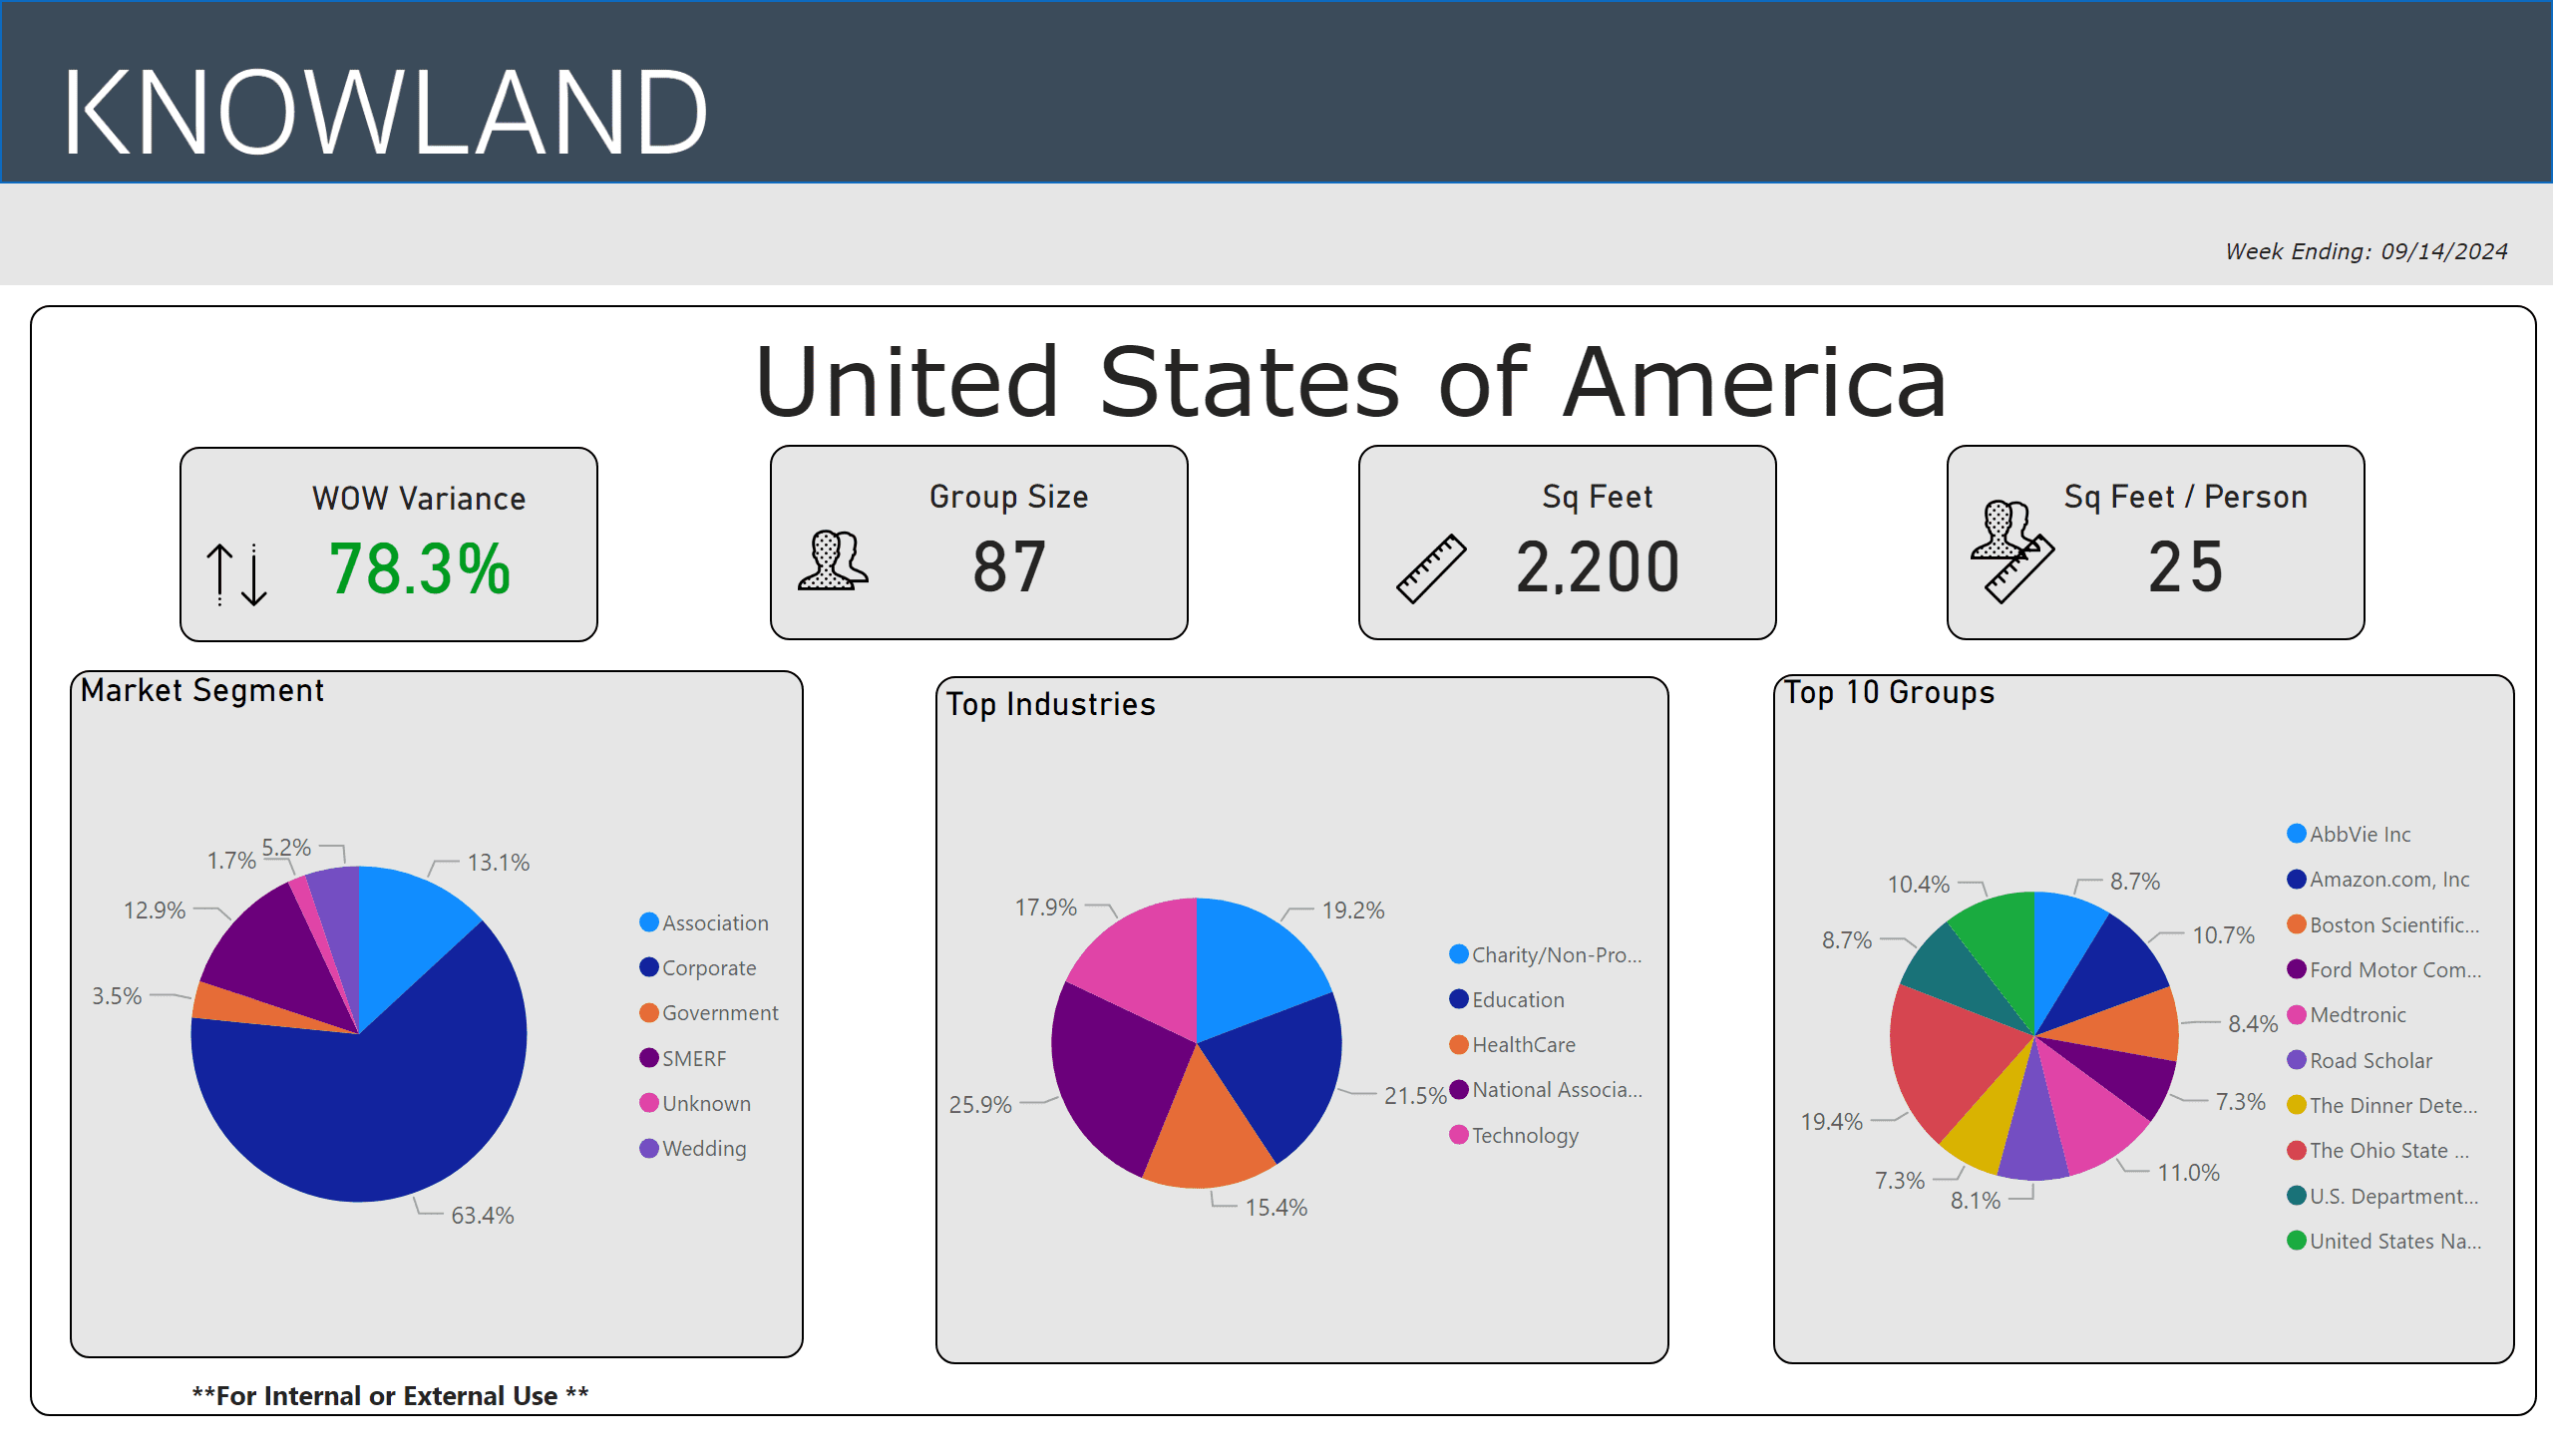
For the week ending September 14, 2024, the U.S. meetings and events volume increased 78.3% compared to the previous week. Post-summer and holiday break, organizations are actively returning to face-to-face meetings. Corporate events share volume was 63.4%, with National Association and Education segments leading growth with 25.9% and 21.5% share respectively, of the top five segments. At 498%, Washington showed the largest week over week growth of the top 5 “mover and shaker” markets.

The average number of attendees for the week was 87, while the average square footage used was 2,200 per event, and square feet used per person was 25.

Trends for Week ending 9-14-24

The top five segments for the week were: National Association, Education, Charity/Non-Profit/Social Services, Technology, and Healthcare.

The full list of top growth market movers and shakers were: Washington DC, Chicago, Denver, Orlando, and Minneapolis-St. Paul, for the largest week over week volume change.

Market Avg Group Size Avg Space Used Sq Ft
Washington DC-MD-VA 111 2,484
Chicago, IL 80 1,716
Denver, CO 84 2,010
Orlando, FL 82 2,090
Minneapolis-St. Paul 91 2,048

These numbers and markets change weekly based on market dynamics and social trends.

Knowland tracks the weekly event activity across 166 U.S. markets with more globally and is expanding coverage regularly.

Talk to a Knowland data expert today for sneak peek at your market trends

Category iconHot Data Trends Tag icon2024 Meeting Trends,  Washington DC Meeting Trends,  Weekly Group Business Trends

Primary Sidebar

Footer

  • Solutions
    • Hotel Properties
    •   – Knowland Classic
    •   – Knowland Select
    • Above Property Management
    •   – Portfolio Capture
    •   – Market Analytics
    • CVBs and DMOs
    • Features & Pricing
    • Try for Free >
    • Demo Request >
  • Resources
    • Hospitality Group & Business Performance Index
    • Success Stories
    • White Papers & Datasheets
    • Webcasts & Events
    • Blog
    • Sales Calculator
    • Glossary
  • Customers
    • Customer Sign In >
    • Support & Training
    • Billing Inquiries >
  • About Us
    • Meet Knowland
    • Culture
    • Job Openings
    • Press & Media
    • Sustainability
    • Contact Us >

[email protected]

[email protected]

202-312-5880

2300 Wilson Blvd. Ste 700 Arlington, VA 22201

Subscribe for news and updates

© 2004–2025 Knowland Group

Privacy Policy

Cookie Settings