• Skip to primary navigation
  • Skip to main content
  • Skip to primary sidebar
  • Skip to footer
Knowland

Knowland

  • Solutions
    • Hotel Properties
    • Above Property Management
      • Portfolio Capture
      • Market Analytics
    • CVBs and DMOs
    • Features & Pricing
  • Resources
    • Meetings Recovery Forecast
    • Hospitality Group & Business Performance Index
    • Success Stories
    • White Papers & Datasheets
    • Webcasts & Events
    • Blog
    • Sales Calculator
    • Glossary
  • Customers
    • Customer Sign In >
    • Support & Training
    • Billing Inquiries >
  • About Us
    • Meet Knowland
    • Culture
    • Job Openings
    • Press & Media
    • Sustainability
    • Contact Us
  • Support
  • Sign In
  • Try for Free
  • Request a Demo
  • Support
  • Sign In >
TRY FOR FREE REQUEST DEMO

Weekly Group Business Trends, Week Ending August 27, 2022

August 29, 2022

Back to school hampers our motivation to meet — but not for long

The number of U.S. meetings and events decreased 4.1% compared to the prior week. This is a minor week-over-week drop, but expected for late August. Compared to December and January, it is one of the slowest months of the year for meetings and events as kids across the U.S. go back to school!

The average number of attendees for the week was 76, while the average square footage used was 1,600 per event and square feet used per person was steady at 21.

august 27 2022

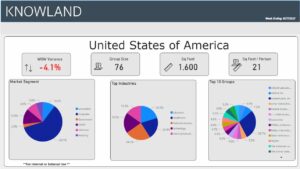
The corporate market segment regained its dominant position with 60.1% of overall meetings business for the week. The the top five segments for the week were: National Association, Healthcare, Education, Technology, and Training/Education.

Markets with the highest week over week variance for number of meetings were Salt Lake City-Ogden, Raleigh-Durham-Chapel Hill, Chicago, Detroit, and the New Jersey Shore. For this week, the New Jersey breaks from the pack with the largest average group size and square feet of meeting space used. It also had the lowest average average square feet per person at 19 while Chicago had the highest square feet per person at only 24 this week.

Market Average Group Size Average Sq Ft Used
Salt Lake City-Ogden, UT 65 1,335
Raleigh-Durham-Chapel Hill, NC 87 1,995
Chicago, IL 76 1,827
Detroit, MI 65 1,408
New Jersey Shore 179 3,402

These numbers and markets change weekly based on market dynamics and social trends.

Knowland tracks the weekly event activity across 113 markets globally and is expanding coverage regularly.

Ready to see what is happening in your market today? Schedule a free market analysis to find out.

Category iconHot Data Trends Tag iconWeekly Group Business Trends

Primary Sidebar

Footer

  • Solutions
    • Hotel Properties
    • Above Property Management
    •   – Portfolio Capture
    •   – Market Analytics
    • CVBs and DMOs
    • Features & Pricing
    • Try for Free >
    • Demo Request >
  • Resources
    • Meetings Recovery Forecast
    • Hospitality Group & Business Performance Index
    • Success Stories
    • White Papers & Datasheets
    • Webcasts & Events
    • Blog
    • Sales Calculator
    • Glossary
  • Customers
    • Customer Sign In >
    • Support & Training
    • Billing Inquiries >
  • About Us
    • Meet Knowland
    • Culture
    • Job Openings
    • Press & Media
    • Sustainability
    • Contact Us >

LinkedIn Profile Twitter Profile Facebook Profile

info@knowland.com

clientcare@knowland.com

202-312-5880

2300 Wilson Blvd. Ste 700 Arlington, VA 22201

Subscribe for news and updates

© 2004–2023 Knowland Group

Privacy Policy

Cookie Settings