• Skip to primary navigation
  • Skip to main content
  • Skip to primary sidebar
  • Skip to footer
Knowland

Knowland

  • Solutions
    • Hotel Properties
      • Knowland Classic
      • Knowland Select
    • Above Property Management
      • Portfolio Capture
      • Market Analytics
    • CVBs and DMOs
    • Features & Pricing
  • Resources
    • Hospitality Group & Business Performance Index
    • Success Stories
    • White Papers & Datasheets
    • Webcasts & Events
    • Blog
    • Sales Calculator
    • Glossary
  • Customers
    • Customer Sign In >
    • Support & Training
    • Billing Inquiries >
  • About Us
    • Meet Knowland
    • Culture
    • Job Openings
    • Press & Media
    • Sustainability
    • Contact Us
  • Support
  • Sign In
  • Try for Free
  • Request a Demo
  • Support
  • Sign In >
TRY FOR FREE REQUEST DEMO

Weekly Group Meetings and Events Stats, Week Ending January 6, 2024

January 10, 2024

Orlando kicks off 2024 with top growth week over week, Religious industry segment breaks into the top 5

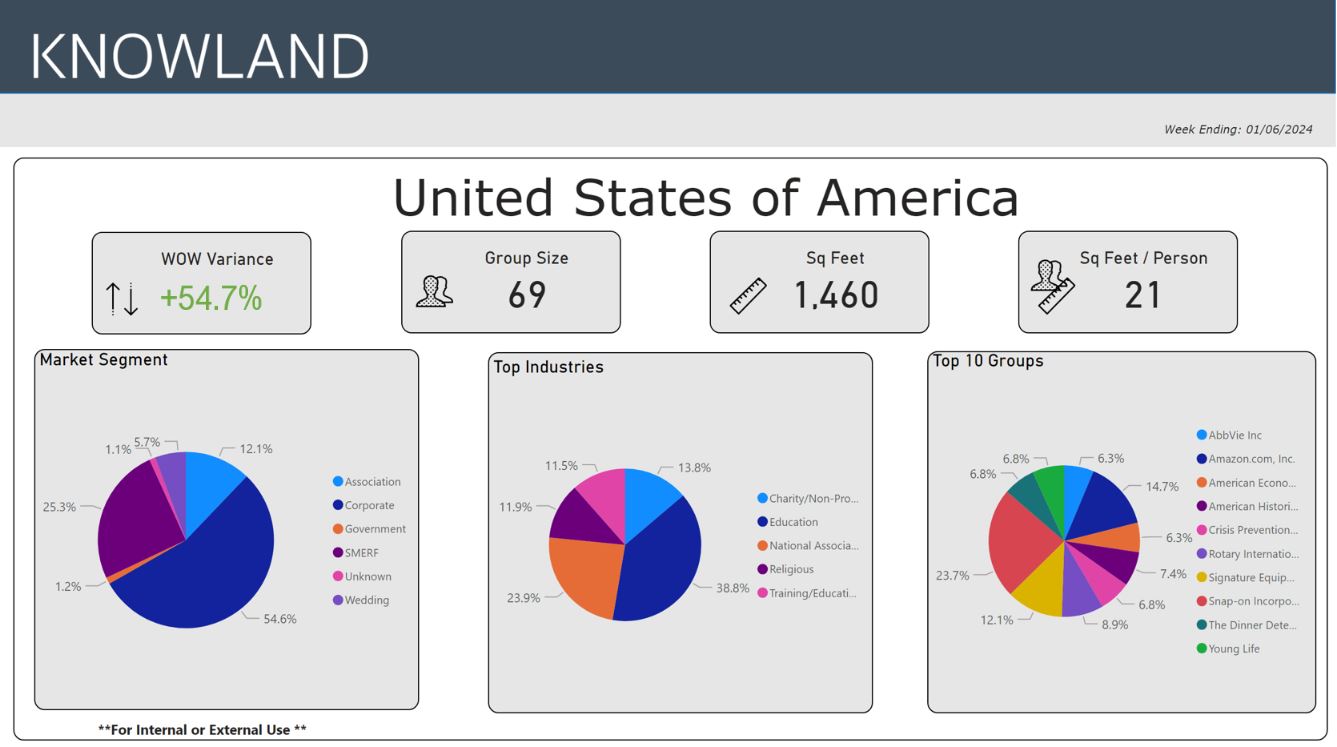
For the week ending January 6, 2024, the number of U.S. meetings and events increased 54.7%. Corporate events share volume dominate at 54.6%, with Education driving the dominant industry share at 38.8% for the week, followed by the National Association segment at 23.9%, for the top five segments.

The average number of attendees for the week was 69, while the average square footage used was 1,460 per event, and square feet used per person was 21.

Jan week 1 trends

The top five segments for the week were: Education, National Association, Charity/Non-Profit/Social Services, Religious and Training/Education.

The full list of top growth market movers and shakers were:  Orlando, Los Angeles, Chicago, Washington DC and Phoenix, with the largest week over week volume change.

Market Average Group Size Average Sq Ft Used
Orlando, FL 125 2,655
Los Angeles-Long Beach, CA 74 1,209
Chicago, IL 107 1,020
Washington, DC-MD-VA 65 1,300
Phoenix, AZ 119 2,450

These numbers and markets change weekly based on market dynamics and social trends.

Knowland tracks the weekly event activity across 166 U.S. markets with more globally and is expanding coverage regularly.

Talk to a Knowland data expert today for sneak peek at your market trends.

Category iconHot Data Trends Tag icon2024 Meeting Trends,  Orlando Events,  Weekly Group Business Trends

Primary Sidebar

Footer

  • Solutions
    • Hotel Properties
    •   – Knowland Classic
    •   – Knowland Select
    • Above Property Management
    •   – Portfolio Capture
    •   – Market Analytics
    • CVBs and DMOs
    • Features & Pricing
    • Try for Free >
    • Demo Request >
  • Resources
    • Hospitality Group & Business Performance Index
    • Success Stories
    • White Papers & Datasheets
    • Webcasts & Events
    • Blog
    • Sales Calculator
    • Glossary
  • Customers
    • Customer Sign In >
    • Support & Training
    • Billing Inquiries >
  • About Us
    • Meet Knowland
    • Culture
    • Job Openings
    • Press & Media
    • Sustainability
    • Contact Us >

[email protected]

[email protected]

202-312-5880

2300 Wilson Blvd. Ste 700 Arlington, VA 22201

Subscribe for news and updates

© 2004–2025 Knowland Group

Privacy Policy

Cookie Settings