
As we welcome the new year, 2019 industry forecasts are showing strong numbers in RevPAR, ADR, and occupancy. However, these numbers are slightly down from earlier forecasting models as transient bookings have slowed. Group bookings remain strong with new bookings velocity 10.4% higher compared to this time last year and up four points compared to the numbers we reported last month (6.4%). Check out of the results in this month’s Pace Navigator!
Sign up now to get the Pace Navigator in your Inbox ›
On the Books Pace & New Bookings Velocity,
as of October 31, 2018
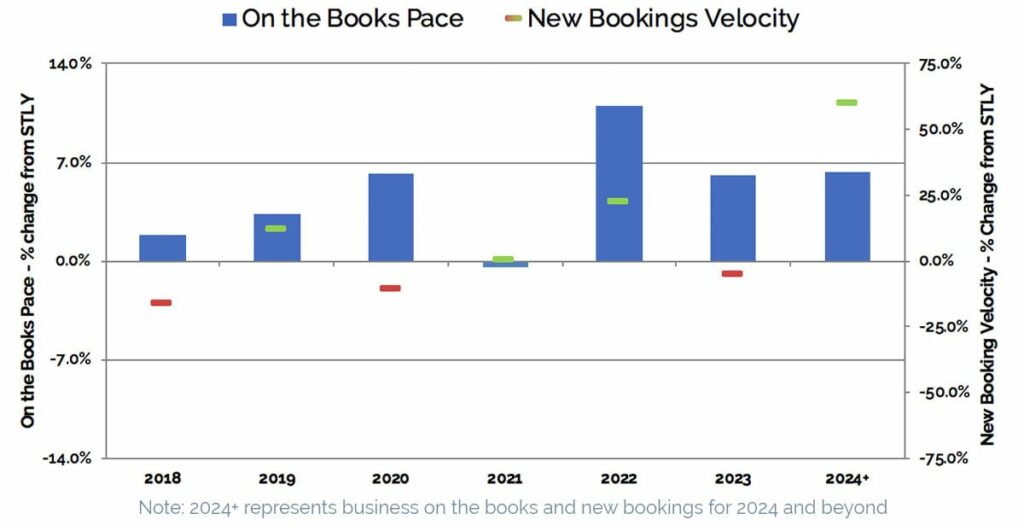
| On the Books (OTB) Pace: +4.3% |
This metric measures the change in definite room nights on the books, as of October 31, 2018, compared to what was on the books the same time last year (STLY), or October 31, 2017. Holding steady since last month, our data indicates 4.3% more definite rooms are on the books, compared to this time in 2017. The graph above shows the OTB Pace change versus same time last year, for each year in the future booking horizon.
| New Bookings Velocity: +10.4% |
This metric measures the change in room nights from newly signed bookings over the last three months, in this case August – October, compared to room nights booked over the same time last year (STLY). Across all future dates, the new bookings velocity is up 10.4% compared to the same 3-month window in 2017. The graph above shows the new bookings velocity change versus same time last year, for each year in the future booking horizon. For example, the +12.2% new bookings velocity for 2019 compares the total room nights from August – October 2018 new bookings for 2019 to the total room nights from August – October 2017 new bookings for 2018.
Our Take on This Month’s Data:
As we welcome the new year, 2019 industry forecasts are in flux, still showing strong numbers in RevPAR (2.4% increase), ADR (2.3% increase), and occupancy (0.1% increase). However, these numbers are slightly down from earlier forecasting models as transient bookings have slowed. Group bookings remain strong with new bookings velocity 10.4% higher compared to this time last year and up four points compared to the numbers we reported in the Pace Navigator last month (6.4%). Additionally, on-the-books (OTB) pace is showing a slight uptick, going from 4.2% last month to 4.3% this month.
For the first time since launching the Pace Navigator, we are seeing positive new bookings velocity for 2021. Although the 0.2% metric may seem small, this represents an increase of 30+ points compared to last month, plus the pace deficit has been cut in half. We will be watching these numbers and hope to see ongoing improvements in new bookings velocity while 2021 continues to push towards positive pace.
As expected, new bookings velocity for 2024+ is still on the rise, up from 46.8% last month to 60.1% this month, with pace improving by 6.3%. When this group business actualizes, the majority of the rooms in the construction pipeline will have been made available and this base will be necessary to maintain profitable occupancy levels.
About the Pace Navigator:
Each month, Knowland collects a significant amount of data on forward-looking group demand across 60+ major North American markets. This data is provided by Convention and Visitor Bureaus (CVBs) that participate in Knowland’s TAP Report. It is unique in providing group room nights booking pace information across the entire multi-year future booking window. This data represents over 30 million annual room nights, and represents nearly 50% of the group business conducted by hotels across these markets.
Sign up now to get the Pace Navigator in your Inbox ›
![]()

