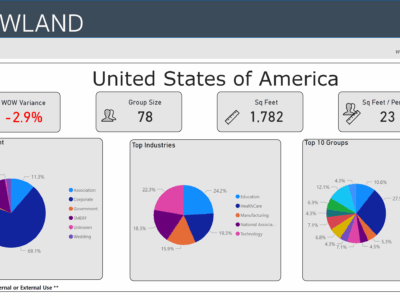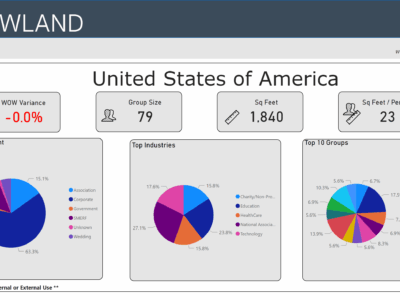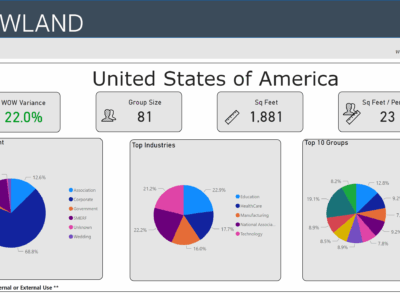
Weekly Group Meetings and Events Stats, Week Ending January 27, 2024
January ends trending up 22% week over week with Education as the star
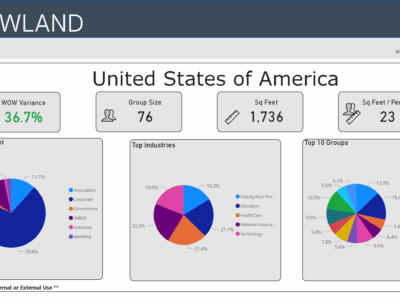
For the week ending January 27, 2024, the number of U.S. meetings and events increased 22.0% as the year gets off to a strong start. Corporate events share volume is 68.8% …