• Skip to primary navigation
  • Skip to main content
  • Skip to primary sidebar
  • Skip to footer
Knowland

Knowland

  • Solutions
    • Hotel Properties
      • Knowland Classic
      • Knowland Select
    • Above Property Management
      • Portfolio Capture
      • Market Analytics
    • CVBs and DMOs
    • Features & Pricing
  • Resources
    • Hospitality Group & Business Performance Index
    • Success Stories
    • White Papers & Datasheets
    • Webcasts & Events
    • Blog
    • Sales Calculator
    • Glossary
  • Customers
    • Customer Sign In >
    • Support & Training
    • Billing Inquiries >
  • About Us
    • Meet Knowland
    • Culture
    • Job Openings
    • Press & Media
    • Sustainability
    • Contact Us
  • Support
  • Sign In
  • Try for Free
  • Request a Demo
  • Support
  • Sign In >
TRY FOR FREE REQUEST DEMO

Weekly Group Meetings and Events Stats, Week Ending February 24, 2024

March 3, 2024

Austin has highest metrics of top 5 growth markets last week

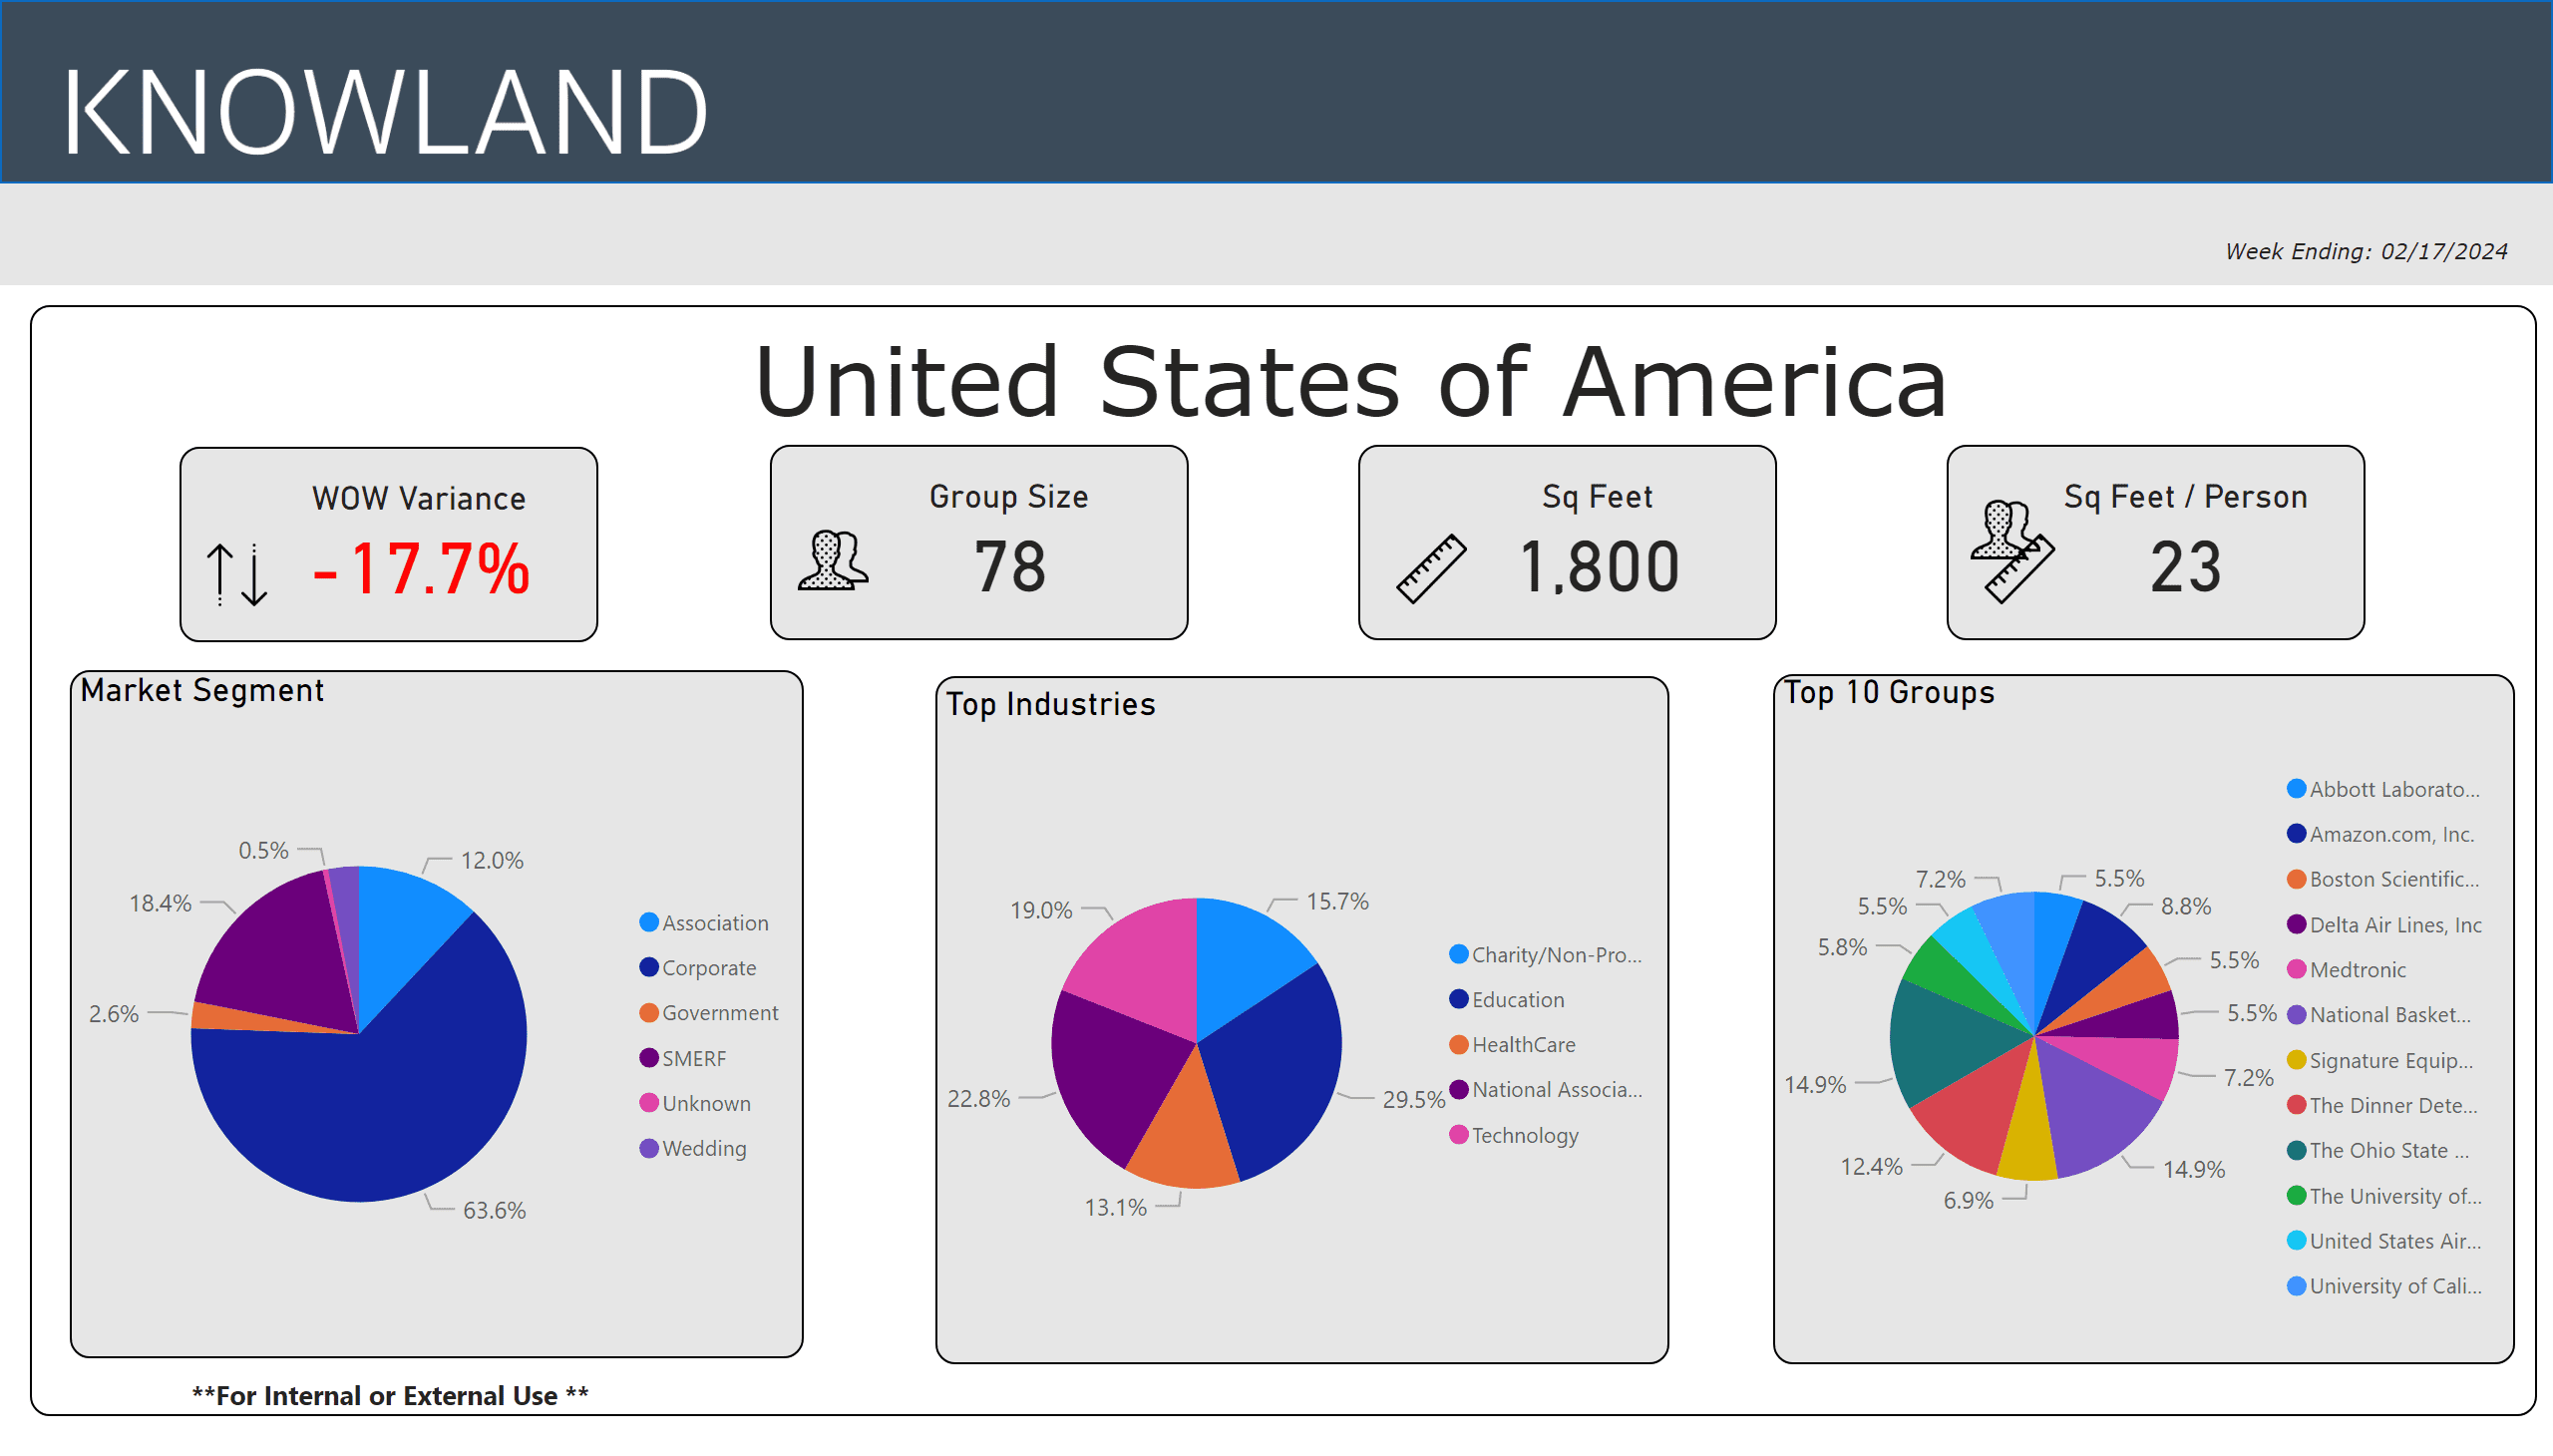
For the week ending February 24, 2024, the number of U.S. meetings and events increased 21.6% compared to the previous week. Corporate events share volume is 64.6%, with Education driving the dominant industry share at 30.5% for the week, followed by the National Association segment at 21.8%, for the top five segments. Chicago showed the largest week over week growth while Austin reported the top group size and space used of the top 5 “mover and shaker” markets.

The average number of attendees for the week was up to 83, while the average square footage used was 1,918 per event, and square feet used per person was up to 23.

Weekly data Trends - Feb 2024

The top five segments for the week were: Education, National Association, Technology, Charity/non-Profit/Social Services, and Healthcare.

The full list of top growth market movers and shakers were:  Chicago, Orlando, Dallas, Washington DC and Austin, with the largest week over week volume change.

Market Average Group Size Average Sq Ft Used
Chicago, IL 66 1,234
Orlando, FL 91 2,474
Dallas, TX 87 2,137
Washington DC-MD-VA 95 2,145
Austin, TX 100 2,898

These numbers and markets change weekly based on market dynamics and social trends.

Knowland tracks the weekly event activity across 166 U.S. markets with more globally and is expanding coverage regularly.

Talk to a Knowland data expert today for sneak peek at your market trends.

Category iconHot Data Trends Tag icon2024 Meeting Trends,  Weekly Group Business Trends

Primary Sidebar

Footer

  • Solutions
    • Hotel Properties
    •   – Knowland Classic
    •   – Knowland Select
    • Above Property Management
    •   – Portfolio Capture
    •   – Market Analytics
    • CVBs and DMOs
    • Features & Pricing
    • Try for Free >
    • Demo Request >
  • Resources
    • Hospitality Group & Business Performance Index
    • Success Stories
    • White Papers & Datasheets
    • Webcasts & Events
    • Blog
    • Sales Calculator
    • Glossary
  • Customers
    • Customer Sign In >
    • Support & Training
    • Billing Inquiries >
  • About Us
    • Meet Knowland
    • Culture
    • Job Openings
    • Press & Media
    • Sustainability
    • Contact Us >

[email protected]

[email protected]

202-312-5880

2300 Wilson Blvd. Ste 700 Arlington, VA 22201

Subscribe for news and updates

© 2004–2025 Knowland Group

Privacy Policy

Cookie Settings