• Skip to primary navigation
  • Skip to main content
  • Skip to primary sidebar
  • Skip to footer
Knowland

Knowland

  • Solutions
    • Hotel Properties
      • Knowland Classic
      • Knowland Select
    • Above Property Management
      • Portfolio Capture
      • Market Analytics
    • CVBs and DMOs
    • Features & Pricing
  • Resources
    • Hospitality Group & Business Performance Index
    • Success Stories
    • White Papers & Datasheets
    • Webcasts & Events
    • Blog
    • Sales Calculator
    • Glossary
  • Customers
    • Customer Sign In >
    • Support & Training
    • Billing Inquiries >
  • About Us
    • Meet Knowland
    • Culture
    • Job Openings
    • Press & Media
    • Sustainability
    • Contact Us
  • Support
  • Sign In
  • Try for Free
  • Request a Demo
  • Support
  • Sign In >
TRY FOR FREE REQUEST DEMO

Weekly Group Meetings and Events Stats, Week Ending December 16, 2023

December 19, 2023

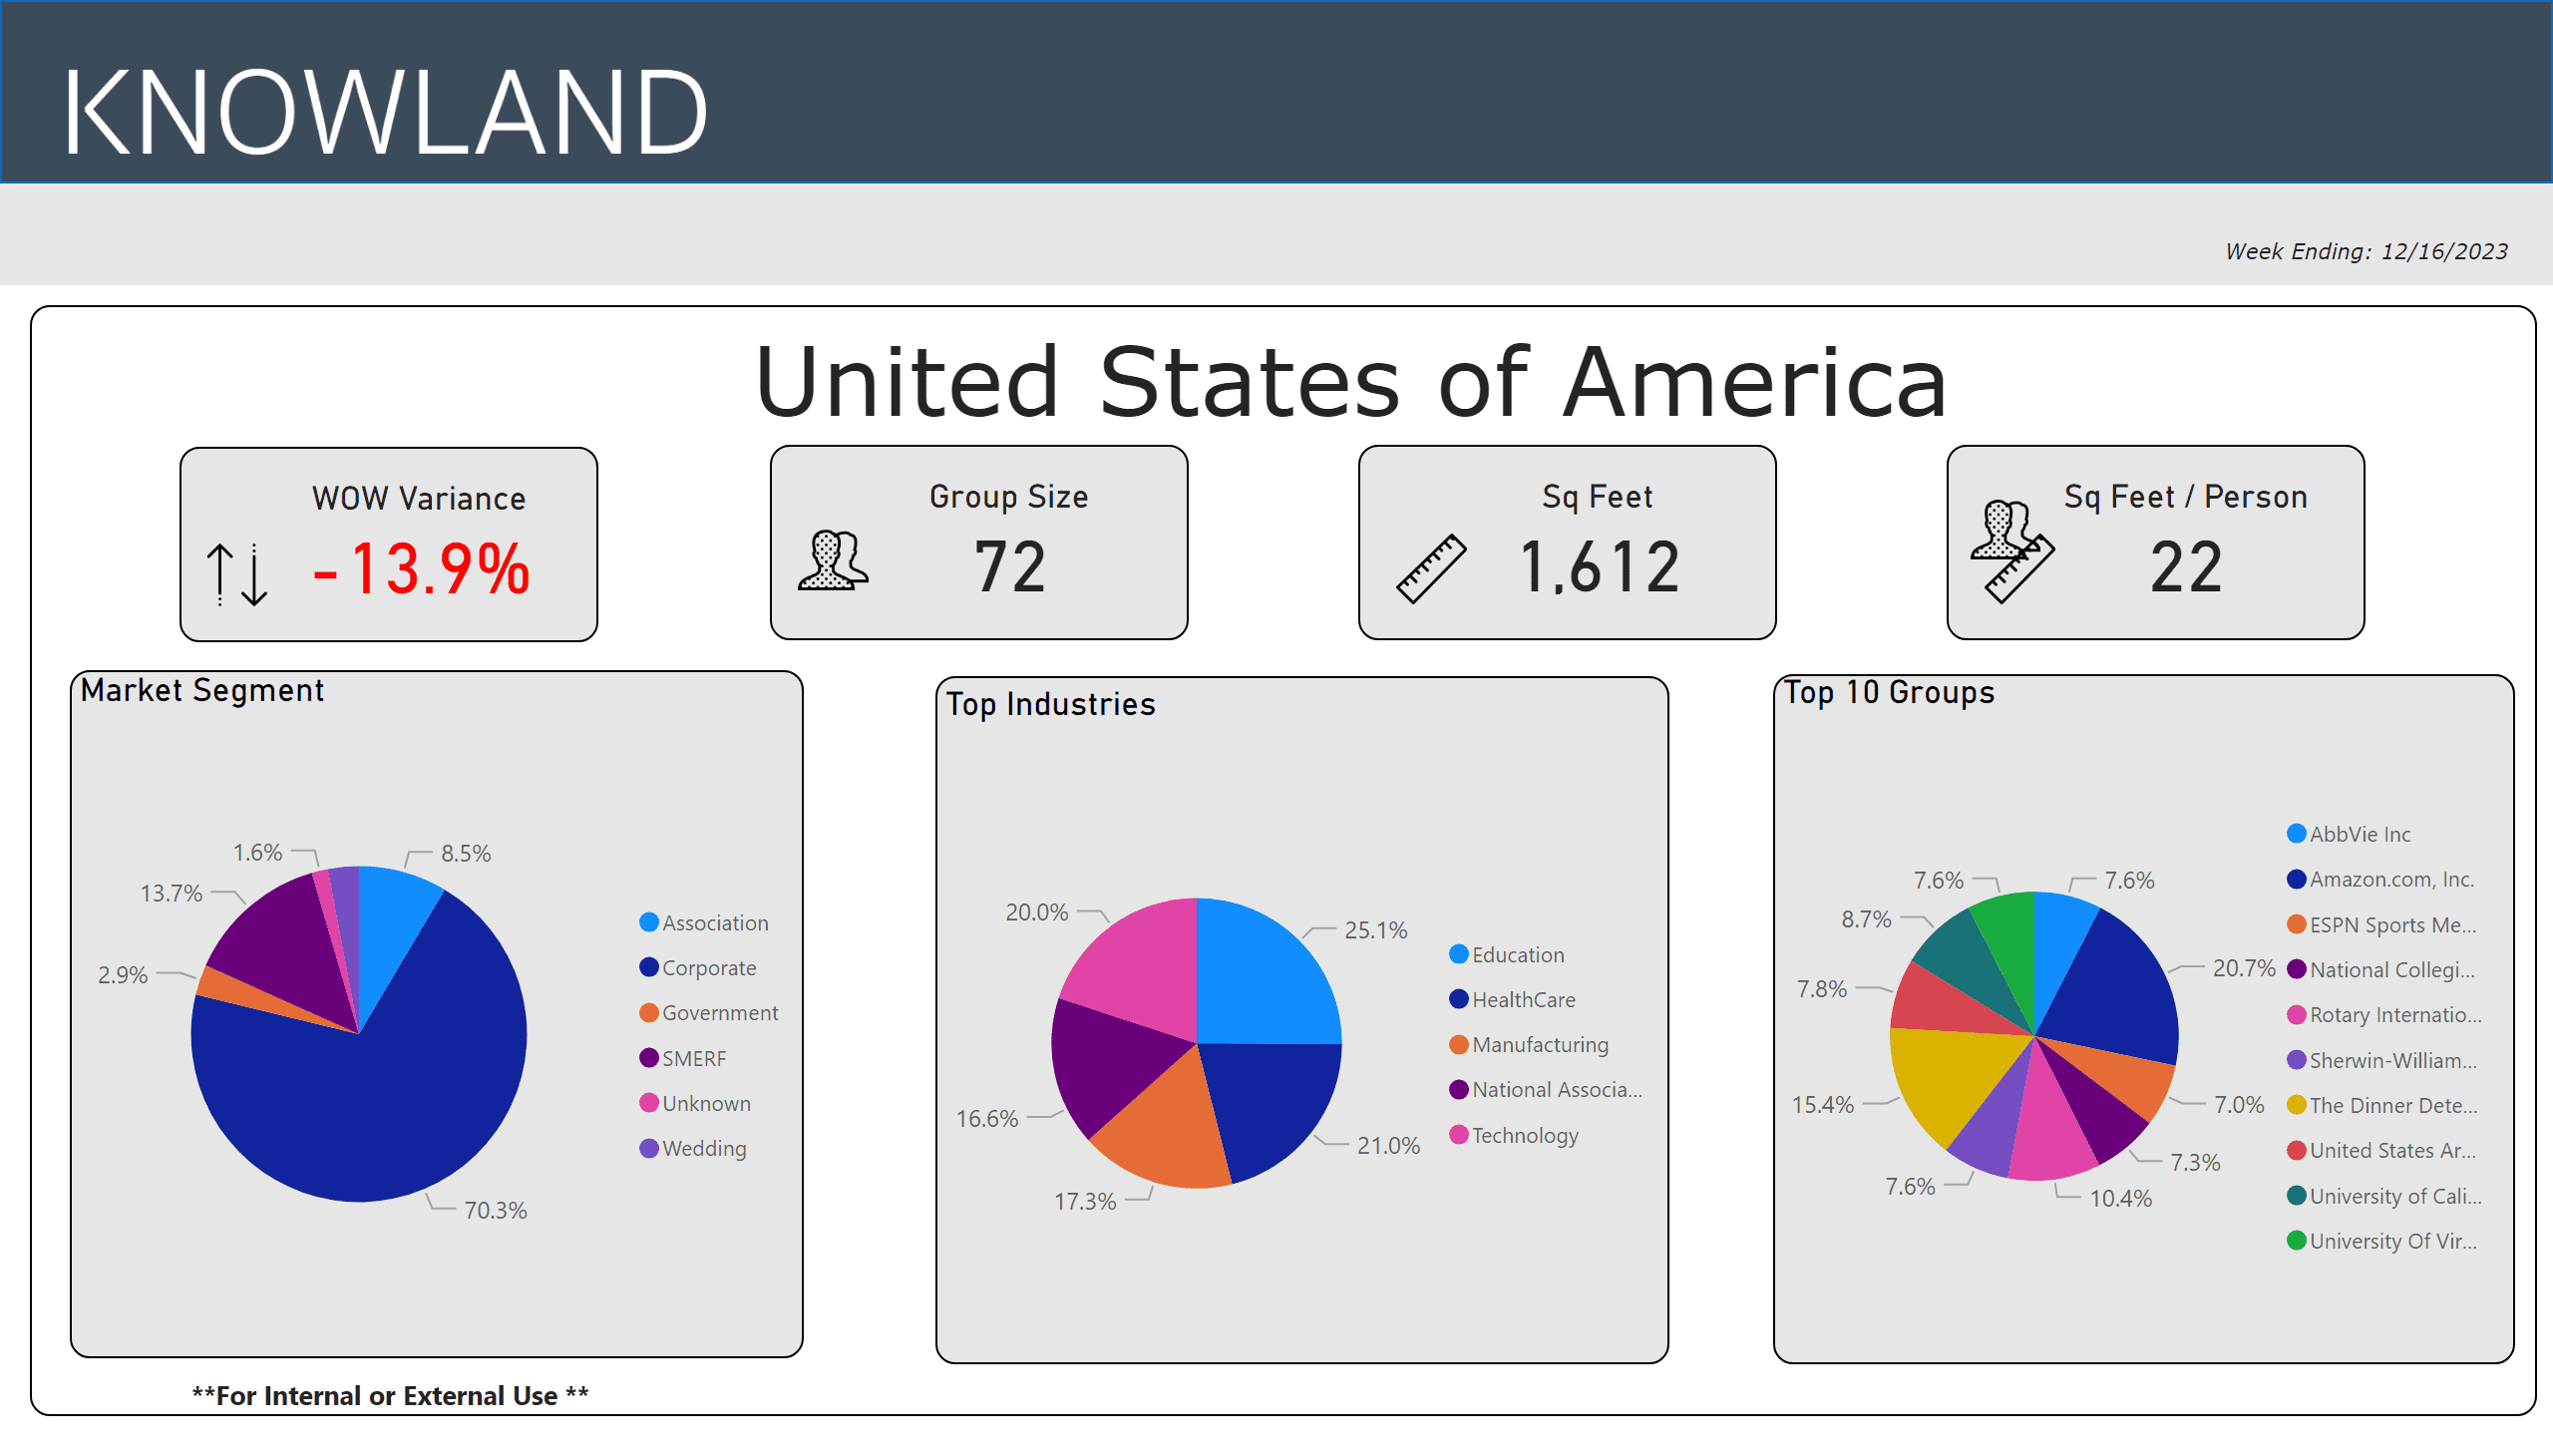
Corporate meetings and events dominate for the week; Education is the top industry

For the week ending December 16, 2023, the number of U.S. meetings and events decreased 13.9%. Corporate events share volume dominate at 70.3%, with Education driving the dominant industry share at 25.1% for the week, followed by the Healthcare segment at 21.0%, for the top five segments.

The average number of attendees for the week was 72 (compared to 76 for the previous week), while the average square footage used was 1,612 per event (compared to 1,736 for the previous week), and square feet used per person was 22.

12-16-23

The top five segments for the week were: Education, Healthcare, Technology, Manufacturing, and National Association.

The full list of top growth market movers and shakers were:  Riverside-San Bernardino, Virginia, Colorado Springs, Baltimore, and Salt Lake City, with the largest week over week volume change.

Market Average Group Size Average Sq Ft Used
Riverside-San Bernardino, CA 82 1,863
Virginia Area 101 1,888
Colorado Springs, CO 50 1,520
Baltimore, MD 87 2,140
Salt Lake City-Ogden, UT 82 2,088

These numbers and markets change weekly based on market dynamics and social trends.

Knowland tracks the weekly event activity across 166 U.S. markets with more globally and is expanding coverage regularly.

Talk to a Knowland data expert today for sneak peek at your market trends.

Category iconHot Data Trends Tag iconWeekly Group Business Trends

Primary Sidebar

Footer

  • Solutions
    • Hotel Properties
    •   – Knowland Classic
    •   – Knowland Select
    • Above Property Management
    •   – Portfolio Capture
    •   – Market Analytics
    • CVBs and DMOs
    • Features & Pricing
    • Try for Free >
    • Demo Request >
  • Resources
    • Hospitality Group & Business Performance Index
    • Success Stories
    • White Papers & Datasheets
    • Webcasts & Events
    • Blog
    • Sales Calculator
    • Glossary
  • Customers
    • Customer Sign In >
    • Support & Training
    • Billing Inquiries >
  • About Us
    • Meet Knowland
    • Culture
    • Job Openings
    • Press & Media
    • Sustainability
    • Contact Us >

[email protected]

[email protected]

202-312-5880

2300 Wilson Blvd. Ste 700 Arlington, VA 22201

Subscribe for news and updates

© 2004–2025 Knowland Group

Privacy Policy

Cookie Settings