• Skip to primary navigation
  • Skip to main content
  • Skip to primary sidebar
  • Skip to footer
Knowland

Knowland

  • Solutions
    • Hotel Properties
      • Knowland Classic
      • Knowland Select
    • Above Property Management
      • Portfolio Capture
      • Market Analytics
    • CVBs and DMOs
    • Features & Pricing
  • Resources
    • Hospitality Group & Business Performance Index
    • Success Stories
    • White Papers & Datasheets
    • Webcasts & Events
    • Blog
    • Sales Calculator
    • Glossary
  • Customers
    • Customer Sign In >
    • Support & Training
    • Billing Inquiries >
  • About Us
    • Meet Knowland
    • Culture
    • Job Openings
    • Press & Media
    • Sustainability
    • Contact Us
  • Support
  • Sign In
  • Try for Free
  • Request a Demo
  • Support
  • Sign In >
TRY FOR FREE REQUEST DEMO

Weekly Group Meetings and Events Stats, Week Ending January 13, 2024

January 17, 2024

High growth week over week for the start of 2024, Education and Technology lead industry segments hosting events

For the week ending January 13, 2024, the number of U.S. meetings and events increased 185.9% as the year gets off to a strong start. Corporate events share volume is up to 68.7% (compared to 54.6% the previous week), with Education driving the dominant industry share at 25.8% for the week, followed by the Technology segment at 21.4%, for the top five segments.

The average number of attendees for the week was 71 (compared to 69 the previous week), while the average square footage used was 1,584 per event (compared to 1,460 the previous week), and square feet used per person was up to 22.

1-13-24 data trends

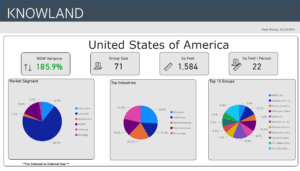
The top five segments for the week were: Education, Technology, National Association, Pharmaceutical/Biotechnology and Healthcare..

The full list of top growth market movers and shakers were:  San Francisco-San Mateo, Phoenix, Atlanta, Washington DC, and Orlando, with the largest week over week volume change.

Market Average Group Size Average Sq Ft Used
San Francisco-San Mateo, CA 21 465
Phoenix, AZ 93 2,065
Atlanta, GA 75 1,984
Washington, DC-MD-VA 62 1,267
Orlando, FL 116 2,692

These numbers and markets change weekly based on market dynamics and social trends.

Knowland tracks the weekly event activity across 166 U.S. markets with more globally and is expanding coverage regularly.

Talk to a Knowland data expert today for sneak peek at your market trends.

Category iconHot Data Trends Tag icon2024 Meeting Trends,  Orlando Events,  Weekly Group Business Trends

Primary Sidebar

Footer

  • Solutions
    • Hotel Properties
    •   – Knowland Classic
    •   – Knowland Select
    • Above Property Management
    •   – Portfolio Capture
    •   – Market Analytics
    • CVBs and DMOs
    • Features & Pricing
    • Try for Free >
    • Demo Request >
  • Resources
    • Hospitality Group & Business Performance Index
    • Success Stories
    • White Papers & Datasheets
    • Webcasts & Events
    • Blog
    • Sales Calculator
    • Glossary
  • Customers
    • Customer Sign In >
    • Support & Training
    • Billing Inquiries >
  • About Us
    • Meet Knowland
    • Culture
    • Job Openings
    • Press & Media
    • Sustainability
    • Contact Us >

[email protected]

[email protected]

202-312-5880

2300 Wilson Blvd. Ste 700 Arlington, VA 22201

Subscribe for news and updates

© 2004–2025 Knowland Group

Privacy Policy

Cookie Settings