• Skip to primary navigation
  • Skip to main content
  • Skip to footer
Knowland

Knowland

  • Solutions
    • Hotel Properties
    • Above Property Management
      • Portfolio Capture
      • Market Analytics
    • Convention Centers and Other Venues
    • Features & Pricing
  • Resources
    • Meetings Recovery Forecast
    • Success Stories
    • White Papers & Datasheets
    • Webcasts & Events
    • Blog
    • Sales Calculator
    • Glossary
  • Customers
    • Customer Sign In >
    • Support & Training
    • Billing Inquiries >
  • About Us
    • Meet Knowland
    • Culture
    • Job Openings
    • Press & Media
    • Sustainability
    • Contact Us
  • Support
  • Sign In
  • Try for Free
  • Request a Demo
  • Support
  • Sign In >
TRY FOR FREE REQUEST DEMO

Weekly Group Business Trends, Week Ending March 19, 2022

March 24, 2022

Event activity showed a decrease due to the Spring Break influence across markets

Additionally, the average number of attendees for the week was 73 people while the average square footage used was 1,632 per event.

Week Ending March 19 2022

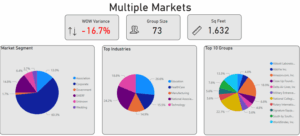
The corporate market segment represented 60.3% of overall business for the week. SMERF-Education, National Association, Technology, and Healthcare were the top industry segments

The individual markets with the highest week over week growth were Washington DC, Atlanta, Orlando, Phoenix, and Chicago. The average growth for these markets was -2.7% week over week, due primarily to the influence of Spring Break vacations and school breaks across markets, particularly in the top eastern markets.

Market Average Attendees Average Square Footage Used
Washington, DC-MD-VA 71 1,950
Atlanta, GA 84 1,806
Orlando, FL 78 1,443
Phoenix, AZ 77 1,760
Chicago, IL 71 1,457

Chicago and Orlando had the lowest space to attendee ratio while Washington, DC had the highest. These numbers evolve every week but are in line with trends of markets at different stages of recovery.

Ready to see what is happening in your market today? Schedule a free market analysis to find out.

Knowland tracks the weekly event activity across 108 markets across the United States.

Category iconHot Data Trends Tag iconWeekly Group Business Trends

Footer

  • Solutions
    • Hotel Properties
    • Above Property Management
    •   – Portfolio Capture
    •   – Market Analytics
    • Convention Centers and Other Venues
    • Features & Pricing
    • Try for Free >
    • Demo Request >
  • Resources
    • Meetings Recovery Forecast
    • Success Stories
    • White Papers & Datasheets
    • Webcasts & Events
    • Blog
    • Sales Calculator
    • Glossary
  • Customers
    • Customer Sign In >
    • Support & Training
    • Billing Inquiries >
  • About Us
    • Meet Knowland
    • Culture
    • Job Openings
    • Press & Media
    • Sustainability
    • Contact Us >

LinkedIn Profile Twitter Profile Facebook Profile

info@knowland.com

clientcare@knowland.com

202-312-5880

2300 Wilson Blvd. Ste 700 Arlington, VA 22201

Subscribe for news and updates

© 2004–2023 Knowland Group

Privacy Policy

Cookie Settings