• Skip to primary navigation
  • Skip to main content
  • Skip to primary sidebar
  • Skip to footer
Knowland

Knowland

  • Solutions
    • Hotel Properties
      • Knowland Classic
      • Knowland Select
    • Above Property Management
      • Portfolio Capture
      • Market Analytics
    • CVBs and DMOs
    • Features & Pricing
  • Resources
    • Hospitality Group & Business Performance Index
    • Success Stories
    • White Papers & Datasheets
    • Webcasts & Events
    • Blog
    • Sales Calculator
    • Glossary
  • Customers
    • Customer Sign In >
    • Support & Training
    • Billing Inquiries >
  • About Us
    • Meet Knowland
    • Culture
    • Job Openings
    • Press & Media
    • Sustainability
    • Contact Us
  • Support
  • Sign In
  • Try for Free
  • Request a Demo
  • Support
  • Sign In >
TRY FOR FREE REQUEST DEMO

Weekly Group Business Trends, Week Ending April 16, 2022

April 19, 2022

Week over week decline as anticipated for the Easter Holiday

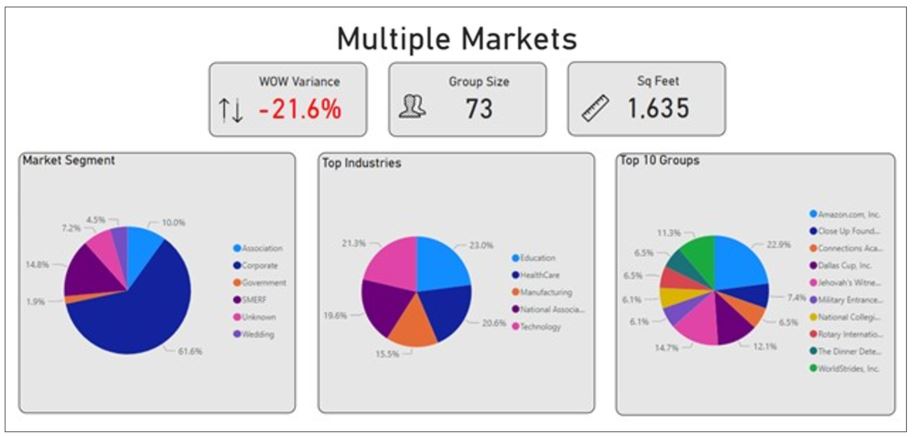
For the week of April 10-16,2022, meetings and events in the U.S. market decreased 21.6% compared to the prior week. The decline was anticipated as it is normal behavior in the week of the Easter Holiday.

Additionally, the average number of attendees for the week was 73 people, while the average square footage used was 1,635 per event.

April 16 Weekly Data

The corporate market segment represented 61.6% of overall business for the week. Education, Technology, Healthcare, National Association, Manufacturing were the top industry segments

The individual markets with the highest week over week growth were Cleveland, Detroit, Oakland, Georgia North, and Louisville. The average growth for these markets was 115.1% week over week.

Market Average Attendees Average Square Footage Used
Cleveland, OH 72 1,363
Detroit, MI 89 2,412
Oakland, CA 75 1,488
Georgia North 70 6,854
Louisville, KY-IN 64 1,174

Cleveland, OH, and Louisville, KY-IN had the lowest space to attendee ratio while Georgia North had the highest. These numbers evolve every week but are in line with trends of markets at different stages of recovery.

Knowland tracks the weekly event activity across 108 markets across the United States.

Ready to see what is happening in your market today? Schedule a free market analysis to find out.

Category iconHot Data Trends Tag iconWeekly Group Business Trends

Primary Sidebar

Footer

  • Solutions
    • Hotel Properties
    •   – Knowland Classic
    •   – Knowland Select
    • Above Property Management
    •   – Portfolio Capture
    •   – Market Analytics
    • CVBs and DMOs
    • Features & Pricing
    • Try for Free >
    • Demo Request >
  • Resources
    • Hospitality Group & Business Performance Index
    • Success Stories
    • White Papers & Datasheets
    • Webcasts & Events
    • Blog
    • Sales Calculator
    • Glossary
  • Customers
    • Customer Sign In >
    • Support & Training
    • Billing Inquiries >
  • About Us
    • Meet Knowland
    • Culture
    • Job Openings
    • Press & Media
    • Sustainability
    • Contact Us >

[email protected]

[email protected]

202-312-5880

2300 Wilson Blvd. Ste 700 Arlington, VA 22201

Subscribe for news and updates

© 2004–2025 Knowland Group

Privacy Policy

Cookie Settings