• Skip to primary navigation
  • Skip to main content
  • Skip to footer
Knowland

Knowland

  • Solutions
    • Hotel Properties
    • Above Property Management
      • Portfolio Capture
      • Market Analytics
    • Convention Centers and Other Venues
    • Features & Pricing
  • Resources
    • Meetings Recovery Forecast
    • Success Stories
    • White Papers & Datasheets
    • Webcasts & Events
    • Blog
    • Sales Calculator
    • Glossary
  • Customers
    • Customer Sign In >
    • Support & Training
    • Billing Inquiries >
  • About Us
    • Meet Knowland
    • Culture
    • Job Openings
    • Press & Media
    • Sustainability
    • Contact Us
  • Support
  • Sign In
  • Try for Free
  • Request a Demo
  • Support
  • Sign In >
TRY FOR FREE REQUEST DEMO

Weekly Group Business Trends, Week Ending April 9, 2022

April 13, 2022

Top 5 growth markets show average 98.5% increase for the week

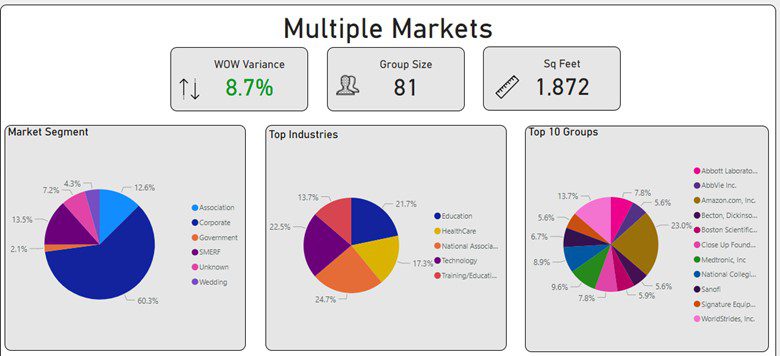
For the week of April 3-9, 2022, the US market realized an 8.7% increase in event activity compared to the prior week. Because of the Easter holiday, we anticipate April will be a month of fits and starts. While we don’t anticipate significant volatility, we do expect normal fluctuations in growth.

Group size increased slightly week over week moving to average number of attendees at 81 people while the average square footage used was 1,872 per event.

Weekly Data Trends Ending 040922

The corporate market segment represented 60.3% of overall business for the week. National Association, Technology, Education, HealthCare, Training/Education were the top industry segments

The individual markets with the highest week over week growth were Chicago, Los Angeles-Long Beach, Colorado Springs, Denver, and Indianapolis. The average growth for these markets was 98.5% week over week.

Market Average Attendees Average Square Footage Used
Chicago, IL 66 1,675
Los Angeles-Long Beach, CA 123 2,183
Colorado Springs, CO 46 916
Denver, CO 72 1,851
Indianapolis, IN 41 700

Los Angeles-Long Beach, CA, and Indianapolis, IN had the lowest space to attendee ratio while Denver, CO had the highest. These numbers evolve every week but are in line with trends of markets at different stages of recovery.

Ready to see what is happening in your market today? Schedule a free market analysis to find out.

Knowland tracks the weekly event activity across 108 markets across the United States.

Category iconHot Data Trends Tag iconWeekly Group Business Trends

Footer

  • Solutions
    • Hotel Properties
    • Above Property Management
    •   – Portfolio Capture
    •   – Market Analytics
    • Convention Centers and Other Venues
    • Features & Pricing
    • Try for Free >
    • Demo Request >
  • Resources
    • Meetings Recovery Forecast
    • Success Stories
    • White Papers & Datasheets
    • Webcasts & Events
    • Blog
    • Sales Calculator
    • Glossary
  • Customers
    • Customer Sign In >
    • Support & Training
    • Billing Inquiries >
  • About Us
    • Meet Knowland
    • Culture
    • Job Openings
    • Press & Media
    • Sustainability
    • Contact Us >

LinkedIn Profile Twitter Profile Facebook Profile

info@knowland.com

clientcare@knowland.com

202-312-5880

2300 Wilson Blvd. Ste 700 Arlington, VA 22201

Subscribe for news and updates

© 2004–2023 Knowland Group

Privacy Policy

Cookie Settings