• Skip to primary navigation
  • Skip to main content
  • Skip to primary sidebar
  • Skip to footer
Knowland

Knowland

  • Solutions
    • Hotel Properties
      • Knowland Classic
      • Knowland Select
    • Above Property Management
      • Portfolio Capture
      • Market Analytics
    • CVBs and DMOs
    • Features & Pricing
  • Resources
    • Hospitality Group & Business Performance Index
    • Success Stories
    • White Papers & Datasheets
    • Webcasts & Events
    • Blog
    • Sales Calculator
    • Glossary
  • Customers
    • Customer Sign In >
    • Support & Training
    • Billing Inquiries >
  • About Us
    • Meet Knowland
    • Culture
    • Job Openings
    • Press & Media
    • Sustainability
    • Contact Us
  • Support
  • Sign In
  • Try for Free
  • Request a Demo
  • Support
  • Sign In >
TRY FOR FREE REQUEST DEMO

Weekly Group Business Trends, Week Ending May 7, 2022

May 10, 2022

Continued growth in event activity

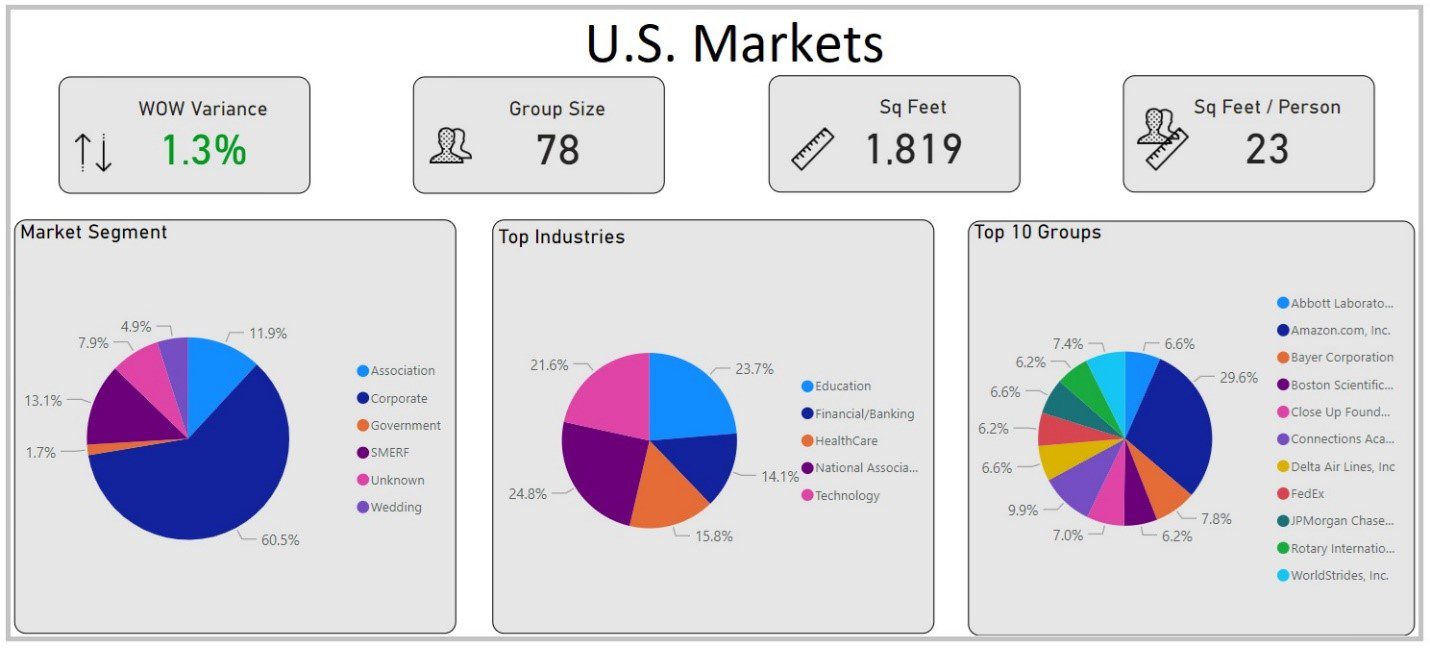
Despite only a 1.3% increase in activity last week, this is the third consecutive week of growth— showing continued positive trajectory for the market. The two weeks before, we saw a 12% and 10.8% increase, respectively.  The average number of attendees for the week was 78 people, while the average square footage used was 1,819 per event.

May 7, 2022 Data Trends

The corporate market segment represented 60.5% of overall business for the week. National Association, Education, Technology, HealthCare, and Financial/Banking were the top industry segments.

Markets with the highest week over week growth were Atlanta, Minneapolis-St Paul, DC, Indianapolis, and Las Vegas. The average growth for these markets was 44.6% week over week.

Market Average Attendees Average Square Footage Used
Atlanta, GA 77 1,890
Minneapolis-St Paul, MN-WI 90 1,785
Washington, DC-MD-VA 76 1,560
Indianapolis, IN 97 1,993
Las Vegas, NV 97 5,547

Minneapolis-St Paul, MN-WI, and Indianapolis, IN had the lowest space to attendee ratio while Las Vegas, NV had the highest. These numbers evolve every week but are in line with trends of markets at different stages of recovery.

Knowland tracks the weekly event activity across 108 markets across the United States.

Ready to see what is happening in your market today? Schedule a free market analysis to find out.

Category iconHot Data Trends Tag iconWeekly Group Business Trends

Primary Sidebar

Footer

  • Solutions
    • Hotel Properties
    •   – Knowland Classic
    •   – Knowland Select
    • Above Property Management
    •   – Portfolio Capture
    •   – Market Analytics
    • CVBs and DMOs
    • Features & Pricing
    • Try for Free >
    • Demo Request >
  • Resources
    • Hospitality Group & Business Performance Index
    • Success Stories
    • White Papers & Datasheets
    • Webcasts & Events
    • Blog
    • Sales Calculator
    • Glossary
  • Customers
    • Customer Sign In >
    • Support & Training
    • Billing Inquiries >
  • About Us
    • Meet Knowland
    • Culture
    • Job Openings
    • Press & Media
    • Sustainability
    • Contact Us >

[email protected]

[email protected]

202-312-5880

2300 Wilson Blvd. Ste 700 Arlington, VA 22201

Subscribe for news and updates

© 2004–2025 Knowland Group

Privacy Policy

Cookie Settings