• Skip to primary navigation
  • Skip to main content
  • Skip to footer
Knowland

Knowland

  • Solutions
    • Hotel Properties
    • Above Property Management
      • Portfolio Capture
      • Market Analytics
    • Convention Centers and Other Venues
    • Features & Pricing
  • Resources
    • Meetings Recovery Forecast
    • Success Stories
    • White Papers & Datasheets
    • Webcasts & Events
    • Blog
    • Sales Calculator
    • Glossary
  • Customers
    • Customer Sign In >
    • Support & Training
    • Billing Inquiries >
  • About Us
    • Meet Knowland
    • Culture
    • Job Openings
    • Press & Media
    • Sustainability
    • Contact Us
  • Support
  • Sign In
  • Try for Free
  • Request a Demo
  • Support
  • Sign In >
TRY FOR FREE REQUEST DEMO

Weekly Group Business Trends, Week Ending July 16, 2022

July 20, 2022

Big come back for event volume after the holiday effect subsides

The post-holiday rebound is reflected in this week’s meetings and events volume. The number of meetings and events increased 79.2% compared to the prior week. This jump reflects the return to summer rhythms for meetings and events after the long July 4th holiday.

The average number of attendees for the week was up to 80 people, while the average square footage used was 1,680 per event and square feet used per person remained steady at 21.

July 16 data trends

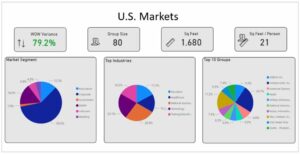
The corporate market segment regained its dominant position with 59.6% of overall meetings business for the week. This week, the Tech segment returned to the top five segments: National Association, Technology, Education, Training/Education, and Healthcare.

Markets with the highest week over week variance for number of meetings were Chicago, Boston, Atlanta, Washington DC, and Denver. Washington DC led with the highest average attendees at 87, with an average 21 sq ft of meeting space per person.

Market Average Attendees Average Square Footage Used
Chicago, IL 81 1,656
Boston, MA 62 1,474
Atlanta, GA 75 1,628
Washington DC MD VA 87 1,823
Denver, CO 75 1,650

These numbers and markets change weekly, with this week revealing some growth in traditional top 25 meeting markets and segments/industries post-holiday.

Knowland tracks the weekly event activity across 113 markets globally and is expanding coverage regularly.

Ready to see what is happening in your market today? Schedule a free market analysis to find out.

Category iconHot Data Trends Tag iconWeekly Group Business Trends

Footer

  • Solutions
    • Hotel Properties
    • Above Property Management
    •   – Portfolio Capture
    •   – Market Analytics
    • Convention Centers and Other Venues
    • Features & Pricing
    • Try for Free >
    • Demo Request >
  • Resources
    • Meetings Recovery Forecast
    • Success Stories
    • White Papers & Datasheets
    • Webcasts & Events
    • Blog
    • Sales Calculator
    • Glossary
  • Customers
    • Customer Sign In >
    • Support & Training
    • Billing Inquiries >
  • About Us
    • Meet Knowland
    • Culture
    • Job Openings
    • Press & Media
    • Sustainability
    • Contact Us >

LinkedIn Profile Twitter Profile Facebook Profile

info@knowland.com

clientcare@knowland.com

202-312-5880

2300 Wilson Blvd. Ste 700 Arlington, VA 22201

Subscribe for news and updates

© 2004–2023 Knowland Group

Privacy Policy

Cookie Settings