• Skip to primary navigation
  • Skip to main content
  • Skip to footer
Knowland

Knowland

  • Solutions
    • Hotel Properties
    • Above Property Management
      • Portfolio Capture
      • Market Analytics
    • Convention Centers and Other Venues
    • Features & Pricing
  • Resources
    • Meetings Recovery Forecast
    • Success Stories
    • White Papers & Datasheets
    • Webcasts & Events
    • Blog
    • Glossary
  • Customers
    • Customer Sign In >
    • Support & Training
    • Billing Inquiries >
  • About Us
    • Meet Knowland
    • Culture
    • Job Openings
    • Press & Media
    • Sustainability
    • Contact Us
  • Support
  • Sign In
  • Request a Demo
  • Support
  • Sign In >
Request a Demo >

Weekly Group Business Trends, Week Ending August 6, 2022

August 10, 2022

Event volume reflects the beginnings of back to school

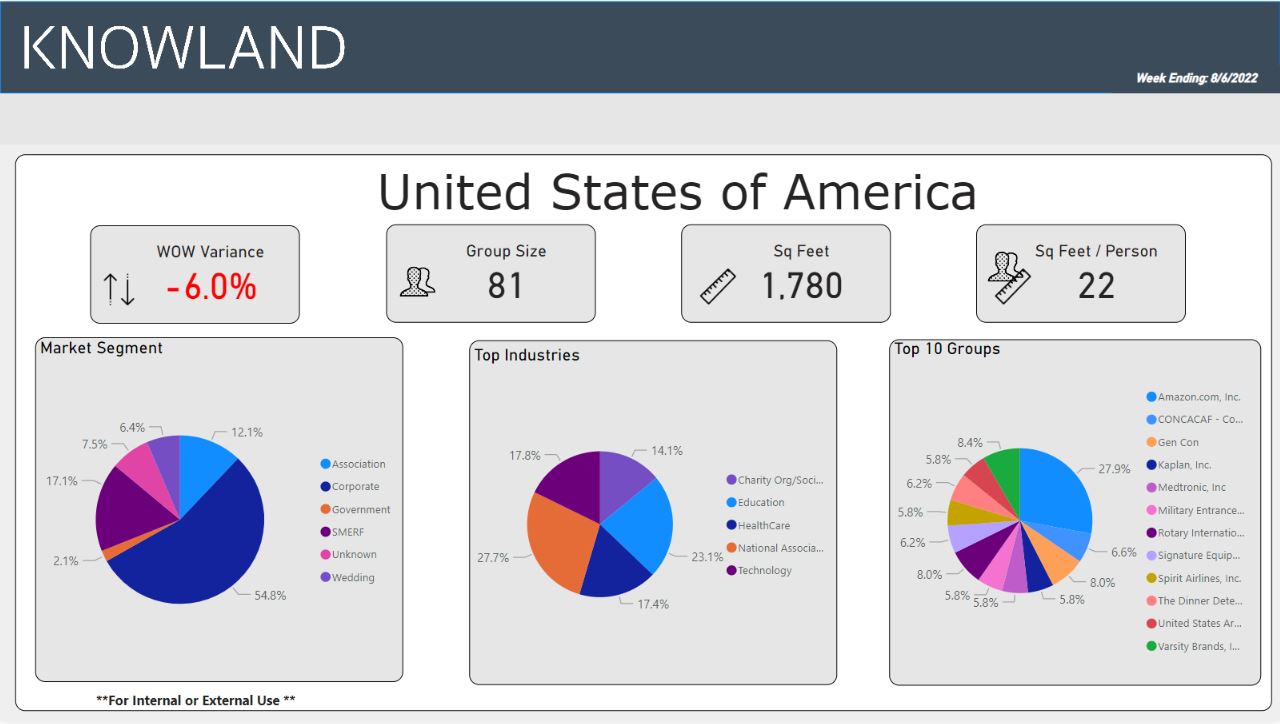
In line with typical seasonal trends. the number of meetings and events decreased 6.0% compared to the prior week. This is common at this time of the year as the south (which has been hot with returning events over the last 3 months) goes back to school. This trend should stabilize in the next week.

The average number of attendees for the week was 81, while the average square footage used was 1,780 per event and square feet used per person was 22.

Week of Aug 6

The corporate market segment regained its dominant position with 54.8% of overall meetings business for the week. The the top five segments for the week were: National Association, Education, Technology, Healthcare, and  Charity/Social Groups.

Markets with the highest week over week variance for number of meetings were Phoenix, Anaheim-Santa Ana, Denver, San Jose-Santa Cruz, and Pittsburgh. For this week, San Jose-Santa Cruz had the highest average square feet per person at 30 people while Phoenix had the lowest square feet per person at 18 attendees.

San D

Market Average Group Size Average Sq Ft Used
Phoenix, AZ 92 1,613
Anaheim – Santa Ana, CA 77 1,620
Denver, CO 80 1,596
San Jose-Santa Cruz, CA 46 1,400
Pittsburgh, PA 65 1,400

These numbers and markets change weekly based on market dynamics and social trends.

Knowland tracks the weekly event activity across 113 markets globally and is expanding coverage regularly.

Ready to see what is happening in your market today? Schedule a free market analysis to find out.

Category iconHot Data Trends Tag iconWeekly Group Business Trends

Footer

  • Solutions
    • Hotel Properties
    • Above Property Management
    •   – Portfolio Capture
    •   – Market Analytics
    • Convention Centers and Other Venues
    • Features & Pricing
    • Demo Request >
  • Resources
    • Meetings Recovery Forecast
    • Success Stories
    • White Papers & Datasheets
    • Webcasts & Events
    • Blog
    • Glossary
  • Customers
    • Customer Sign In >
    • Support & Training
    • Billing Inquiries >
  • About Us
    • Meet Knowland
    • Culture
    • Job Openings
    • Press & Media
    • Sustainability
    • Contact Us >

LinkedIn Profile Twitter Profile Facebook Profile

info@knowland.com

clientcare@knowland.com

202-312-5880

1735 N Lynn St. Suite 600
Arlington, VA 22209

Subscribe for news and updates

© 2004–2023 Knowland Group

Privacy Policy

Cookie Settings