• Skip to primary navigation
  • Skip to main content
  • Skip to footer
Knowland

Knowland

  • Solutions
    • Hotel Properties
    • Above Property Management
      • Portfolio Capture
      • Market Analytics
    • Convention Centers and Other Venues
    • Features & Pricing
  • Resources
    • Meetings Recovery Forecast
    • Success Stories
    • White Papers & Datasheets
    • Webcasts & Events
    • Blog
    • Glossary
  • Customers
    • Customer Sign In >
    • Support & Training
    • Billing Inquiries >
  • About Us
    • Meet Knowland
    • Culture
    • Job Openings
    • Press & Media
    • Sustainability
    • Contact Us
  • Support
  • Sign In
  • Request a Demo
  • Support
  • Sign In >
Request a Demo >

Weekly Group Business Trends, Week Ending August 13, 2022

August 17, 2022

Event activity growth flattens as the end of summer nears

The number of meetings and events decreased 4.0% compared to the prior week. This is typical for the end of summer seasonal trends as families take final vacations and prepare for back to school. Upward growth trends are expected to return after Labor Day.

The average number of attendees for the week was 71, while the average square footage used was 1,576 per event and square feet used per person was steady at 22.

August 13 2022

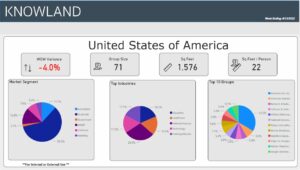
The corporate market segment regained its dominant position with 59.5% of overall meetings business for the week. Education moves into spot #2 as meetings for back to school are held. The the top five segments for the week were: National Association, Education, Healthcare, Technology, and  Training/Education.

Markets with the highest week over week variance for number of meetings were Salt Lake City, Detroit, Denver, Las Vegas, and Seattle. For this week, Las Vegas had the highest average square feet per person at 32 while Salt Lake/Detroit/Denver all tied with the lowest square feet per person at 17.

San D

Market Average Group Size Average Sq Ft Used
Salt Lake City – Ogden, UT 78 1,293
Detroit, MI 43 728
Denver, CO 92 1,710
Las Vegas, NV 100 3,184
Seattle, WA 70 1,599

These numbers and markets change weekly based on market dynamics and social trends.

Knowland tracks the weekly event activity across 113 markets globally and is expanding coverage regularly.

Ready to see what is happening in your market today? Schedule a free market analysis to find out.

Category iconHot Data Trends Tag iconWeekly Group Business Trends

Footer

  • Solutions
    • Hotel Properties
    • Above Property Management
    •   – Portfolio Capture
    •   – Market Analytics
    • Convention Centers and Other Venues
    • Features & Pricing
    • Demo Request >
  • Resources
    • Meetings Recovery Forecast
    • Success Stories
    • White Papers & Datasheets
    • Webcasts & Events
    • Blog
    • Glossary
  • Customers
    • Customer Sign In >
    • Support & Training
    • Billing Inquiries >
  • About Us
    • Meet Knowland
    • Culture
    • Job Openings
    • Press & Media
    • Sustainability
    • Contact Us >

LinkedIn Profile Twitter Profile Facebook Profile

info@knowland.com

clientcare@knowland.com

202-312-5880

1735 N Lynn St. Suite 600
Arlington, VA 22209

Subscribe for news and updates

© 2004–2023 Knowland Group

Privacy Policy

Cookie Settings