• Skip to primary navigation
  • Skip to main content
  • Skip to primary sidebar
  • Skip to footer
Knowland

Knowland

  • Solutions
    • Hotel Properties
    • Above Property Management
      • Portfolio Capture
      • Market Analytics
    • CVBs and DMOs
    • Features & Pricing
  • Resources
    • Meetings Recovery Forecast
    • Hospitality Group & Business Performance Index
    • Success Stories
    • White Papers & Datasheets
    • Webcasts & Events
    • Blog
    • Sales Calculator
    • Glossary
  • Customers
    • Customer Sign In >
    • Support & Training
    • Billing Inquiries >
  • About Us
    • Meet Knowland
    • Culture
    • Job Openings
    • Press & Media
    • Sustainability
    • Contact Us
  • Support
  • Sign In
  • Try for Free
  • Request a Demo
  • Support
  • Sign In >
TRY FOR FREE REQUEST DEMO

Weekly Group Business Trends, Week Ending September 10, 2022

September 15, 2022

Fall is back to school and back to meetings and events; New York starts to make a comeback

The number of U.S. meetings and events increased 8.8% compared to the prior week. As we move into the Fall, expect to see steadily increasing meetings and events growth.

The average number of attendees for the week was 78, while the average square footage used was 1,650 per event and square feet used per person was steady at 21.

Sept 10 2022

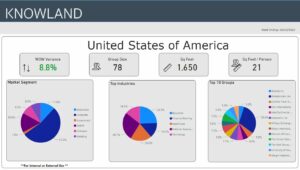
The corporate market segment continues its dominant position with 53.3% of overall meetings business for the week. The top five segments for the week were: National Association, Education, Healthcare, Financial/Banking, and Technology.

Markets with the highest week over week variance for number of meetings were Washington DC, New York, Boston, Los Angeles-Long Beach, and Chicago. For this week, the Washington DC market had the largest average group size (84 attendees) and square feet of meeting space used (2,106 sq ft). Los Angeles-Long Beach had the lowest average average square feet per person at 19 while New York had the highest square feet per person at 26 this week.

Market Average Group Size Average Sq Ft Used
Washington, DC 84 2,106
New York, NY 57 1,468
Boston, MA 64 1,350
Los Angeles – Long Beach, CA 64 1,210
Chicago, IL 73 1,498

These numbers and markets change weekly based on market dynamics and social trends.

Knowland tracks the weekly event activity across 128 U.S. markets with more globally and is expanding coverage regularly.

Ready to see what is happening in your market today? Schedule a free market analysis to find out.

Category iconHot Data Trends Tag iconWeekly Group Business Trends

Primary Sidebar

Footer

  • Solutions
    • Hotel Properties
    • Above Property Management
    •   – Portfolio Capture
    •   – Market Analytics
    • CVBs and DMOs
    • Features & Pricing
    • Try for Free >
    • Demo Request >
  • Resources
    • Meetings Recovery Forecast
    • Hospitality Group & Business Performance Index
    • Success Stories
    • White Papers & Datasheets
    • Webcasts & Events
    • Blog
    • Sales Calculator
    • Glossary
  • Customers
    • Customer Sign In >
    • Support & Training
    • Billing Inquiries >
  • About Us
    • Meet Knowland
    • Culture
    • Job Openings
    • Press & Media
    • Sustainability
    • Contact Us >

LinkedIn Profile Twitter Profile Facebook Profile

info@knowland.com

clientcare@knowland.com

202-312-5880

2300 Wilson Blvd. Ste 700 Arlington, VA 22201

Subscribe for news and updates

© 2004–2023 Knowland Group

Privacy Policy

Cookie Settings