• Skip to primary navigation
  • Skip to main content
  • Skip to footer
Knowland

Knowland

  • Solutions
    • Hotel Properties
    • Above Property Management
      • Portfolio Capture
      • Market Analytics
    • Convention Centers and Other Venues
    • Features & Pricing
  • Resources
    • Meetings Recovery Forecast
    • Success Stories
    • White Papers & Datasheets
    • Webcasts & Events
    • Blog
    • Sales Calculator
    • Glossary
  • Customers
    • Customer Sign In >
    • Support & Training
    • Billing Inquiries >
  • About Us
    • Meet Knowland
    • Culture
    • Job Openings
    • Press & Media
    • Sustainability
    • Contact Us
  • Support
  • Sign In
  • Try for Free
  • Request a Demo
  • Support
  • Sign In >
TRY FOR FREE REQUEST DEMO

Weekly Group Business Trends, Week Ending October 1, 2022

October 5, 2022

Meeting volume aligns with end of quarter seasonal trends

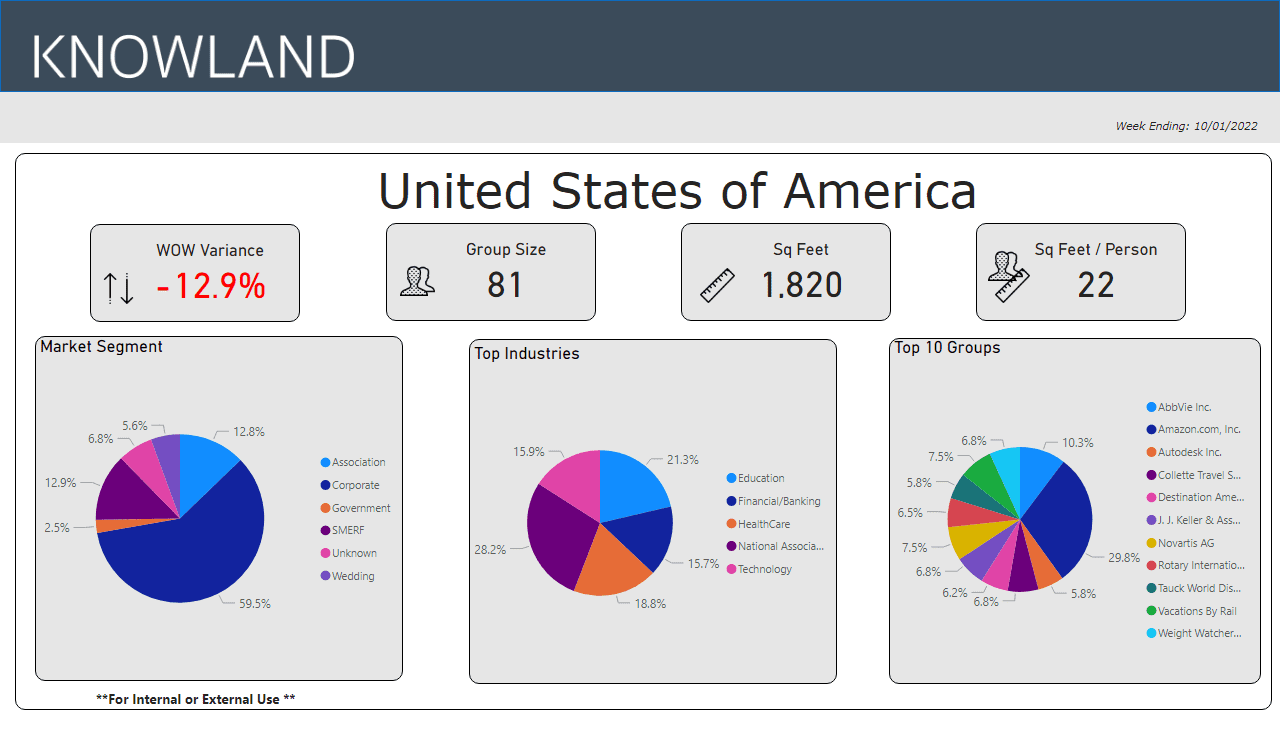
The number of U.S. meetings and events decreased 12.9% compared to the prior week.  This trend is typical for the last week of the month, and especially the last month of a quarter.

Ready to see what is happening in your market today? Schedule a free market analysis to find out.

The average number of attendees for the week remained at 81, while the average square footage used was 1,820 per event and square feet used per person was steady at 22.

End of Sept

The corporate market segment was steady with week-over-week to 59.5% (vs 59.8% last week) of overall meetings business for the week. The top five segments for the week were: National Association, Education, Healthcare, Technology and Financial/Banking.

Markets with the highest week over week variance for number of meetings were Denver, San Francisco-San Mateo, Baltimore, Memphis, and Des Moines.. Average group size and space used were higher than last week. For this week, Des Moines had the largest average group size at 110 attendees (compared to 79 Anaheim/Salt Lake City last week) and San Francisco had the largest square feet of meeting space used at 1,960 sq ft (compared to 1,760 sq ft in Washington DC last week).

Market Average Group Size Average Sq Ft Used
Denver, CO 89 1,927
San Francisco – San Mateo, CA 80 1,960
Baltimore, MD 78 1,860
Memphis, TN 61 1,604
Des Moines, IA 110 1,760

These numbers and markets change weekly based on market dynamics and social trends.

Knowland tracks the weekly event activity across 128 U.S. markets with more globally and is expanding coverage regularly.

Talk to a Knowland data expert today for sneak peek at your market trends.

Category iconHot Data Trends Tag iconWeekly Group Business Trends

Footer

  • Solutions
    • Hotel Properties
    • Above Property Management
    •   – Portfolio Capture
    •   – Market Analytics
    • Convention Centers and Other Venues
    • Features & Pricing
    • Try for Free >
    • Demo Request >
  • Resources
    • Meetings Recovery Forecast
    • Success Stories
    • White Papers & Datasheets
    • Webcasts & Events
    • Blog
    • Sales Calculator
    • Glossary
  • Customers
    • Customer Sign In >
    • Support & Training
    • Billing Inquiries >
  • About Us
    • Meet Knowland
    • Culture
    • Job Openings
    • Press & Media
    • Sustainability
    • Contact Us >

LinkedIn Profile Twitter Profile Facebook Profile

info@knowland.com

clientcare@knowland.com

202-312-5880

2300 Wilson Blvd. Ste 700 Arlington, VA 22201

Subscribe for news and updates

© 2004–2023 Knowland Group

Privacy Policy

Cookie Settings