• Skip to primary navigation
  • Skip to main content
  • Skip to footer
Knowland

Knowland

  • Solutions
    • Hotel Properties
    • Above Property Management
      • Portfolio Capture
      • Market Analytics
    • Convention Centers and Other Venues
    • Features & Pricing
  • Resources
    • Meetings Recovery Forecast
    • Success Stories
    • White Papers & Datasheets
    • Webcasts & Events
    • Blog
    • Sales Calculator
    • Glossary
  • Customers
    • Customer Sign In >
    • Support & Training
    • Billing Inquiries >
  • About Us
    • Meet Knowland
    • Culture
    • Job Openings
    • Press & Media
    • Sustainability
    • Contact Us
  • Support
  • Sign In
  • Try for Free
  • Request a Demo
  • Support
  • Sign In >
TRY FOR FREE REQUEST DEMO

Weekly Group Business Trends, Week Ending October 29, 2022

October 31, 2022

Meeting volume decreases last week as weddings cool

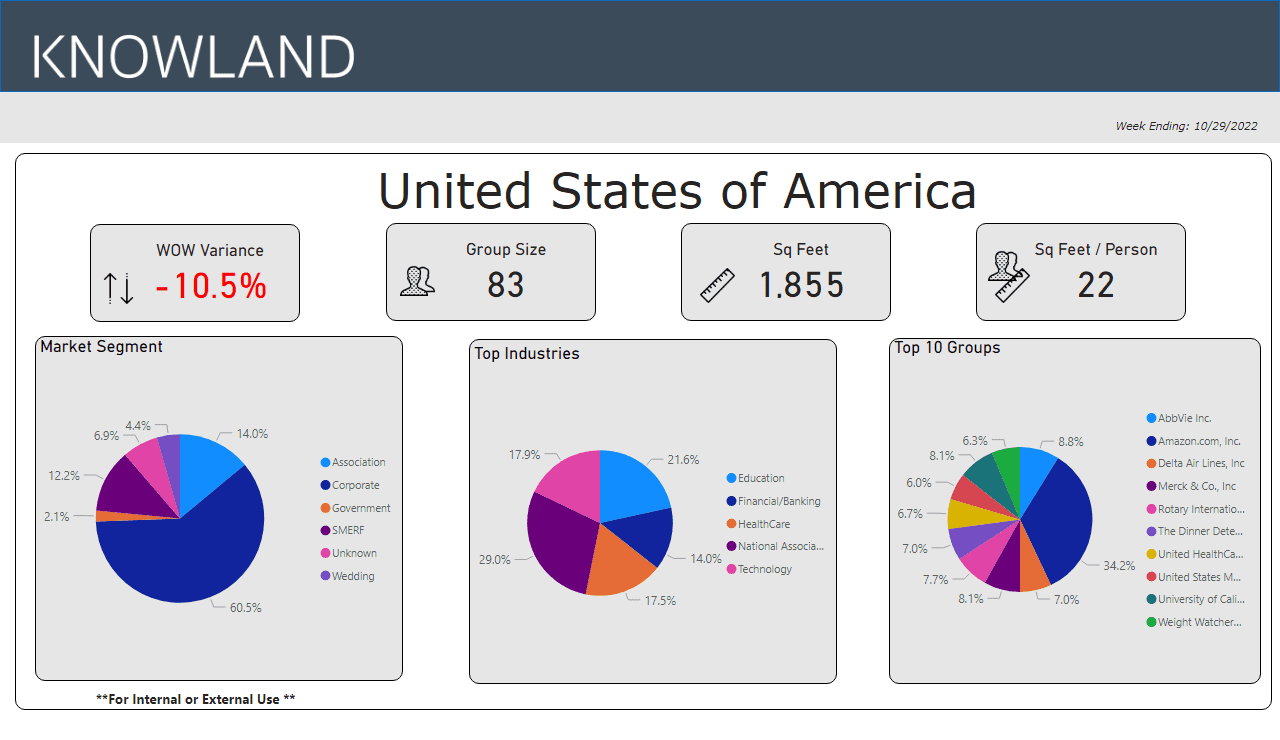
The number of U.S. meetings and events decreased 10.5% compared to the prior week. The wedding market segment showed the largest percentage decrease, compared to its share of events.

Ready to see what is happening in your market today? Schedule a free market analysis to find out.

The average number of attendees for the week was 83, while the average square footage used decreased to 1,855 per event and square feet used per person was steady at 22.

The corporate market segment moved up a couple points at 60.5% (vs 57.8% last week) of overall meetings business for the week. The top five segments for the week were: National Association, Education, Technology, Healthcare, and Training/Education.

Markets with the highest week over week variance for number of meetings were Salt Lake City, Austin, Detroit, California-Central Coast, and Greenville-Spartanburg.  For this week, Greenville-Spartanburg had both the largest average group size at 97 and the largest square feet of meeting space used at 1,974 for the week’s movers and shakers.

Market Average Group Size Average Sq Ft Used
Salt Lake City – Ogden, UT 81 1,316
Austin, TX 60 1,725
Detroit, MI 75 1,408
California, Central Coast 93 1,800
Greenville=Spartanburg, SC 97 1,974

These numbers and markets change weekly based on market dynamics and social trends.

Knowland tracks the weekly event activity across 128 U.S. markets with more globally and is expanding coverage regularly.

Talk to a Knowland data expert today for sneak peek at your market trends.

Category iconHot Data Trends Tag iconWeekly Group Business Trends

Footer

  • Solutions
    • Hotel Properties
    • Above Property Management
    •   – Portfolio Capture
    •   – Market Analytics
    • Convention Centers and Other Venues
    • Features & Pricing
    • Try for Free >
    • Demo Request >
  • Resources
    • Meetings Recovery Forecast
    • Success Stories
    • White Papers & Datasheets
    • Webcasts & Events
    • Blog
    • Sales Calculator
    • Glossary
  • Customers
    • Customer Sign In >
    • Support & Training
    • Billing Inquiries >
  • About Us
    • Meet Knowland
    • Culture
    • Job Openings
    • Press & Media
    • Sustainability
    • Contact Us >

LinkedIn Profile Twitter Profile Facebook Profile

info@knowland.com

clientcare@knowland.com

202-312-5880

2300 Wilson Blvd. Ste 700 Arlington, VA 22201

Subscribe for news and updates

© 2004–2023 Knowland Group

Privacy Policy

Cookie Settings