• Skip to primary navigation
  • Skip to main content
  • Skip to footer
Knowland

Knowland

  • Solutions
    • Hotel Properties
    • Above Property Management
      • Portfolio Capture
      • Market Analytics
    • Convention Centers and Other Venues
    • Features & Pricing
  • Resources
    • Meetings Recovery Forecast
    • Success Stories
    • White Papers & Datasheets
    • Webcasts & Events
    • Blog
    • Sales Calculator
    • Glossary
  • Customers
    • Customer Sign In >
    • Support & Training
    • Billing Inquiries >
  • About Us
    • Meet Knowland
    • Culture
    • Job Openings
    • Press & Media
    • Sustainability
    • Contact Us
  • Support
  • Sign In
  • Try for Free
  • Request a Demo
  • Support
  • Sign In >
TRY FOR FREE REQUEST DEMO

Weekly Group Business Trends, Week Ending November 12, 2022

November 16, 2022

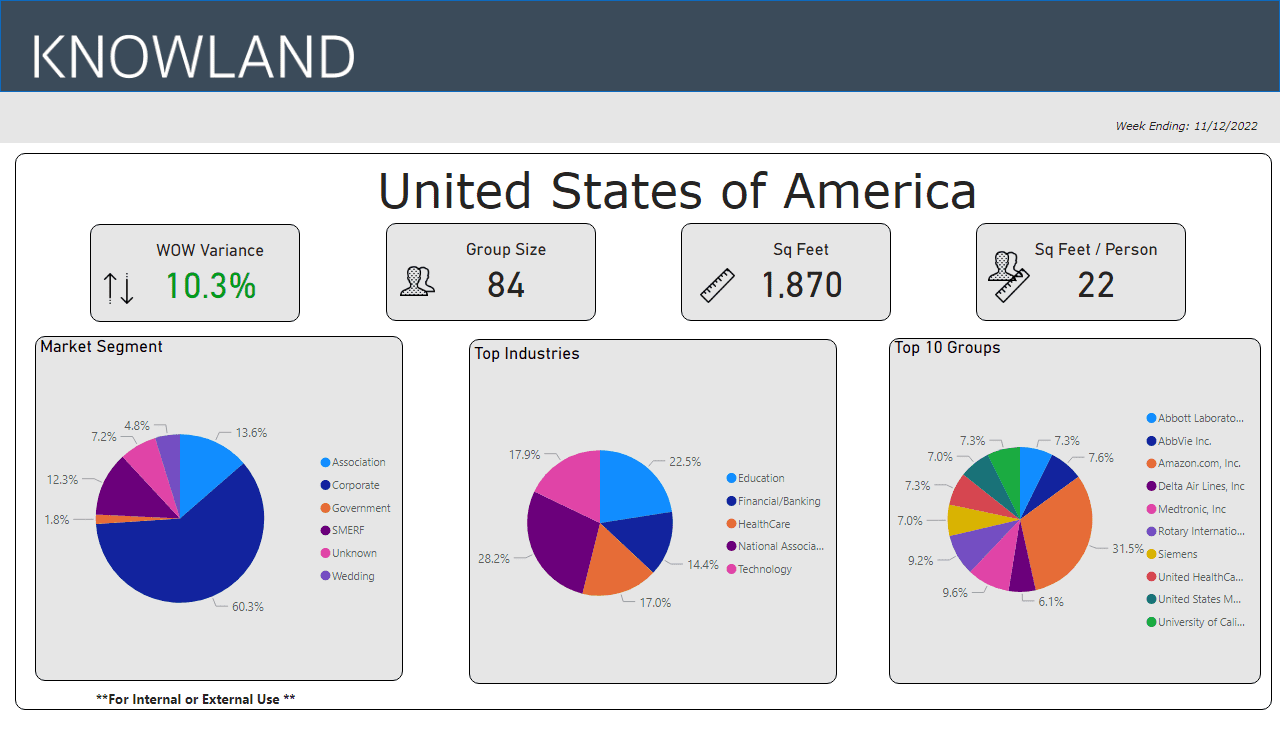
Meeting volume up 10.3% over last week

The number of U.S. meetings and events increased 10.3% compared to the prior week. Top mover and shaker markets are becoming more varied, yet still tend to fall in the top 25 markets.

Ready to see what is happening in your market today? Schedule a free market analysis to find out.

The average number of attendees for the week was up to 84 (compared to 86 last week), while the average square footage used was 1,870 (compared to  1,895) per event and square feet used per person was steady at 22.

Weekly data 11-12-22

The corporate market segment kept steady at 60.3% (vs 57.4% last week) of overall meetings business for the week. The top five segments for the week were: National Association, Education, Technology, Healthcare, and Finance/Banking.

Markets with the highest week over week variance for number of meetings were San Diego, Houston, Phoenix, Denver, and Los Angeles-Long Beach.  For this week, Los Angeles-Long Beach had the largest average group size at 101 and Phoenix has the largest square feet of meeting space used at 2,214 for the week’s movers and shakers.

Market Average Group Size Average Sq Ft Used
San Diego, CA 85 1,800
Houston, TX 82 1,836
Phoenix, AZ 98 2,214
Denver, CO 87 2,039
Los Angeles-Long Beach, CA 101 1,830

These numbers and markets change weekly based on market dynamics and social trends.

Knowland tracks the weekly event activity across 128 U.S. markets with more globally and is expanding coverage regularly.

Talk to a Knowland data expert today for sneak peek at your market trends.

Category iconHot Data Trends Tag iconWeekly Group Business Trends

Footer

  • Solutions
    • Hotel Properties
    • Above Property Management
    •   – Portfolio Capture
    •   – Market Analytics
    • Convention Centers and Other Venues
    • Features & Pricing
    • Try for Free >
    • Demo Request >
  • Resources
    • Meetings Recovery Forecast
    • Success Stories
    • White Papers & Datasheets
    • Webcasts & Events
    • Blog
    • Sales Calculator
    • Glossary
  • Customers
    • Customer Sign In >
    • Support & Training
    • Billing Inquiries >
  • About Us
    • Meet Knowland
    • Culture
    • Job Openings
    • Press & Media
    • Sustainability
    • Contact Us >

LinkedIn Profile Twitter Profile Facebook Profile

info@knowland.com

clientcare@knowland.com

202-312-5880

2300 Wilson Blvd. Ste 700 Arlington, VA 22201

Subscribe for news and updates

© 2004–2023 Knowland Group

Privacy Policy

Cookie Settings