• Skip to primary navigation
  • Skip to main content
  • Skip to primary sidebar
  • Skip to footer
Knowland

Knowland

  • Solutions
    • Hotel Properties
      • Knowland Classic
      • Knowland Select
    • Above Property Management
      • Portfolio Capture
      • Market Analytics
    • CVBs and DMOs
    • Features & Pricing
  • Resources
    • Hospitality Group & Business Performance Index
    • Success Stories
    • White Papers & Datasheets
    • Webcasts & Events
    • Blog
    • Sales Calculator
    • Glossary
  • Customers
    • Customer Sign In >
    • Support & Training
    • Billing Inquiries >
  • About Us
    • Meet Knowland
    • Culture
    • Job Openings
    • Press & Media
    • Sustainability
    • Contact Us
  • Support
  • Sign In
  • Try for Free
  • Request a Demo
  • Support
  • Sign In >
TRY FOR FREE REQUEST DEMO

Weekly Group Business Trends, Week Ending November 19, 2022

November 23, 2022

Corporate meetings continue to drive growth

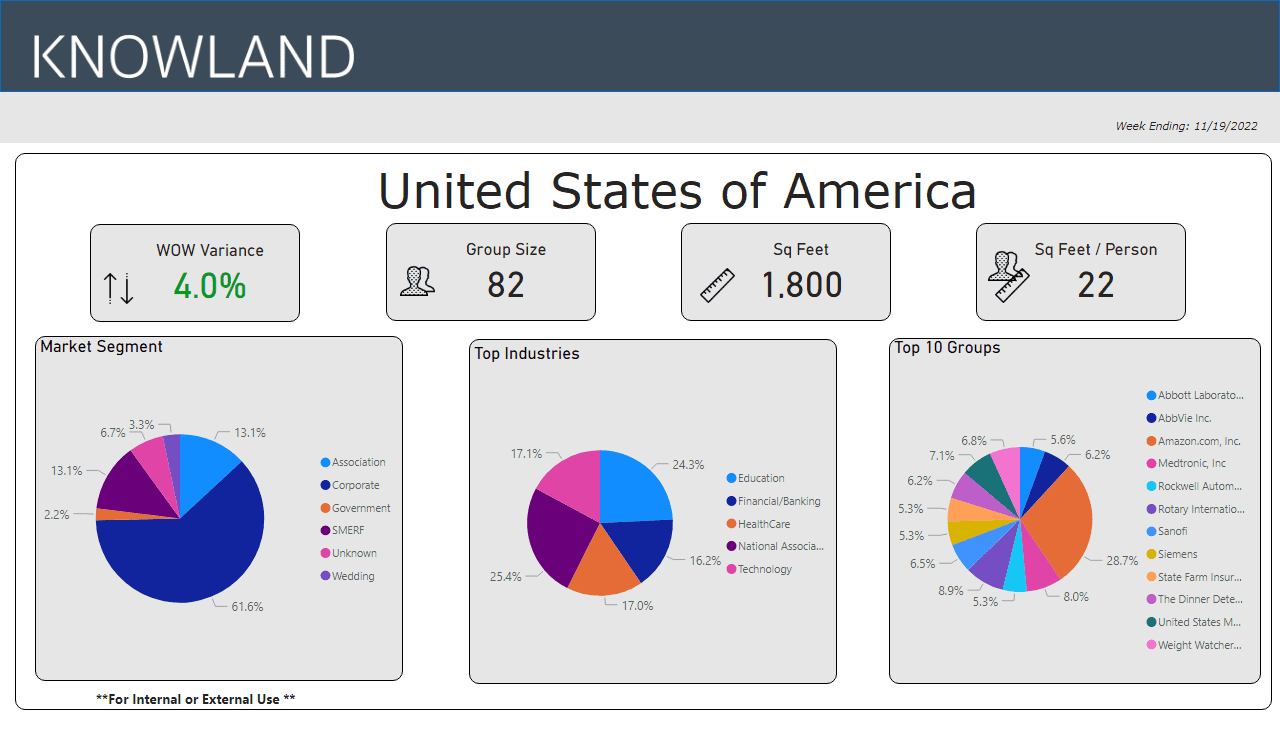
The number of U.S. meetings and events increased 4.0% compared to the prior week. The Corporate marketing segment leads with 61.6% of meetings market share as we head into the Thanksgiving holiday next week, when volume will slow down due to the 4-day holiday weekend.

Ready to see what is happening in your market today? Schedule a free market analysis to find out.

The average number of attendees for the week was 82 (compared to 84 last week), while the average square footage used was 1,800 (compared to  1,870) per event and square feet used per person was steady at 22.

11-19-22 trends

While the corporate market segment inched up slightly to 61.6% (vs 60.3% last week) of overall meetings business for the week, associations was ranked #2 at 13.1%. The top five segments for the week were: National Association, Education, Technology, Healthcare, and Finance/Banking.

Markets with the highest week over week variance for number of meetings were Orlando, Las Vegas, Washington DC, Miami-Hialeah, and Dallas.  For this week,Orlando had the largest average group size at 104 and Miami-Hialeah has the largest square feet of meeting space used at 2,683 for the week’s movers and shakers.

Market Average Group Size Average Sq Ft Used
Orlando, FL 105 2,400
Las Vegas, NA 64 2,050
Washington DC-MD-VA 85 1,837
Miami-Hialeah, FL 80 2,683
Dallas, TX 77 1,550

These numbers and markets change weekly based on market dynamics and social trends.

Knowland tracks the weekly event activity across 128 U.S. markets with more globally and is expanding coverage regularly.

Talk to a Knowland data expert today for sneak peek at your market trends.

Category iconHot Data Trends Tag iconWeekly Group Business Trends

Primary Sidebar

Footer

  • Solutions
    • Hotel Properties
    •   – Knowland Classic
    •   – Knowland Select
    • Above Property Management
    •   – Portfolio Capture
    •   – Market Analytics
    • CVBs and DMOs
    • Features & Pricing
    • Try for Free >
    • Demo Request >
  • Resources
    • Hospitality Group & Business Performance Index
    • Success Stories
    • White Papers & Datasheets
    • Webcasts & Events
    • Blog
    • Sales Calculator
    • Glossary
  • Customers
    • Customer Sign In >
    • Support & Training
    • Billing Inquiries >
  • About Us
    • Meet Knowland
    • Culture
    • Job Openings
    • Press & Media
    • Sustainability
    • Contact Us >

[email protected]

[email protected]

202-312-5880

2300 Wilson Blvd. Ste 700 Arlington, VA 22201

Subscribe for news and updates

© 2004–2025 Knowland Group

Privacy Policy

Cookie Settings