• Skip to primary navigation
  • Skip to main content
  • Skip to primary sidebar
  • Skip to footer
Knowland

Knowland

  • Solutions
    • Hotel Properties
    • Above Property Management
      • Portfolio Capture
      • Market Analytics
    • CVBs and DMOs
    • Features & Pricing
    • Certifications
  • Resources
    • Hospitality Group & Business Performance Index
    • Success Stories
    • White Papers & Datasheets
    • Webcasts & Events
    • Blog
    • Sales Calculator
    • Glossary
  • Customers
    • Customer Sign In >
    • Support & Training
    • Billing Inquiries >
  • About Us
    • Meet Knowland
    • Culture
    • Job Openings
    • Press & Media
    • Sustainability
    • Contact Us
  • Support
  • Sign In
  • Try for Free
  • Request a Demo
  • Support
  • Sign In >
TRY FOR FREE REQUEST DEMO

Weekly Group Business Trends, Week Ending December 17, 2022

December 20, 2022

Meeting volume slows consistent with the holiday season

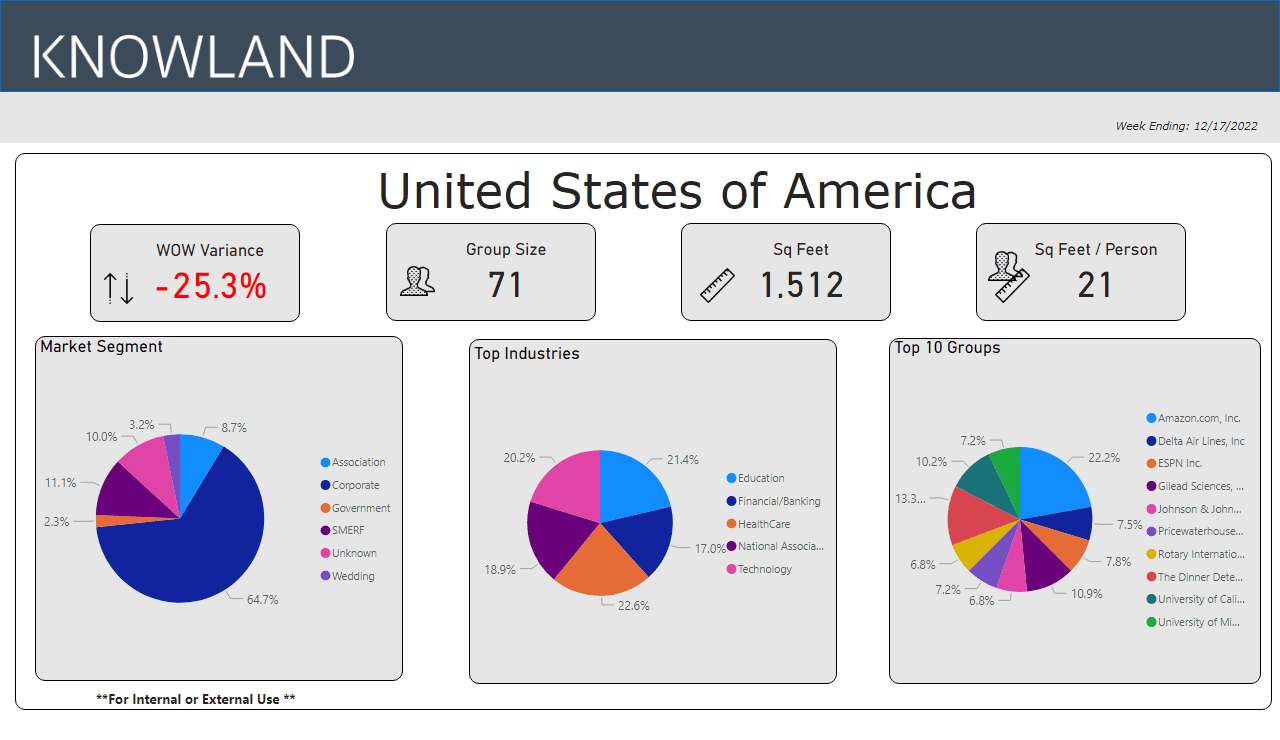
The number of U.S. meetings and events decreased 25.3% compared to the prior week. The change reflects consistent meeting performance as companies head into the holidays.

Ready to see what is happening in your market today? Schedule a free market analysis to find out.

The average number of attendees for the week was 77 (compared to 80 last week), while the average square footage used was 1,512 (compared to  1,781) per event and square feet used per person was 21.

12-17-22 Hot Data Trends for Meetings

While the corporate market segment was steady at 64.7% (vs 65.7% last week) of overall meetings business for the week. The top five segments for the week were: Healthcare, Education, Technology, National Association, and Financial/Banking.

The top market movers and shakers were: Detroit, Los Angeles-Long Beach, Fort Meyers, Melbourne-Titusville, and Mobile.

Market Average Group Size Average Sq Ft Used
Detroit, MI 76 1,600
Los Angeles-Long Beach, CA 96 1,829
Fort Myers, FL 92 2,100
Melbourne-Titusville, FL 32 520
Mobile, AL 77 1,230

These numbers and markets change weekly based on market dynamics and social trends.

Knowland tracks the weekly event activity across 128 U.S. markets with more globally and is expanding coverage regularly.

Talk to a Knowland data expert today for sneak peek at your market trends.

Category iconHot Data Trends Tag iconWeekly Group Business Trends

Primary Sidebar

Footer

  • Solutions
    • Hotel Properties
    • Above Property Management
    •   – Portfolio Capture
    •   – Market Analytics
    • CVBs and DMOs
    • Features & Pricing
    • Certifications
    • Try for Free >
    • Demo Request >
  • Resources
    • Hospitality Group & Business Performance Index
    • Success Stories
    • White Papers & Datasheets
    • Webcasts & Events
    • Blog
    • Sales Calculator
    • Glossary
  • Customers
    • Customer Sign In >
    • Support & Training
    • Billing Inquiries >
  • About Us
    • Meet Knowland
    • Culture
    • Job Openings
    • Press & Media
    • Sustainability
    • Contact Us >

info@knowland.com

clientcare@knowland.com

202-312-5880

2300 Wilson Blvd. Ste 700 Arlington, VA 22201

Subscribe for news and updates

© 2004–2023 Knowland Group

Privacy Policy

Cookie Settings