• Skip to primary navigation
  • Skip to main content
  • Skip to footer
Knowland

Knowland

  • Solutions
    • Hotel Properties
    • Above Property Management
      • Portfolio Capture
      • Market Analytics
    • Convention Centers and Other Venues
    • Features & Pricing
  • Resources
    • Meetings Recovery Forecast
    • Success Stories
    • White Papers & Datasheets
    • Webcasts & Events
    • Blog
    • Glossary
  • Customers
    • Customer Sign In >
    • Support & Training
    • Billing Inquiries >
  • About Us
    • Meet Knowland
    • Culture
    • Job Openings
    • Press & Media
    • Sustainability
    • Contact Us
  • Support
  • Sign In
  • Request a Demo
  • Support
  • Sign In >
Request a Demo >

Weekly Group Business Trends, Week Ending December 3, 2022

December 6, 2022

Rebound after the holiday weekend drives strong meeting volume growth

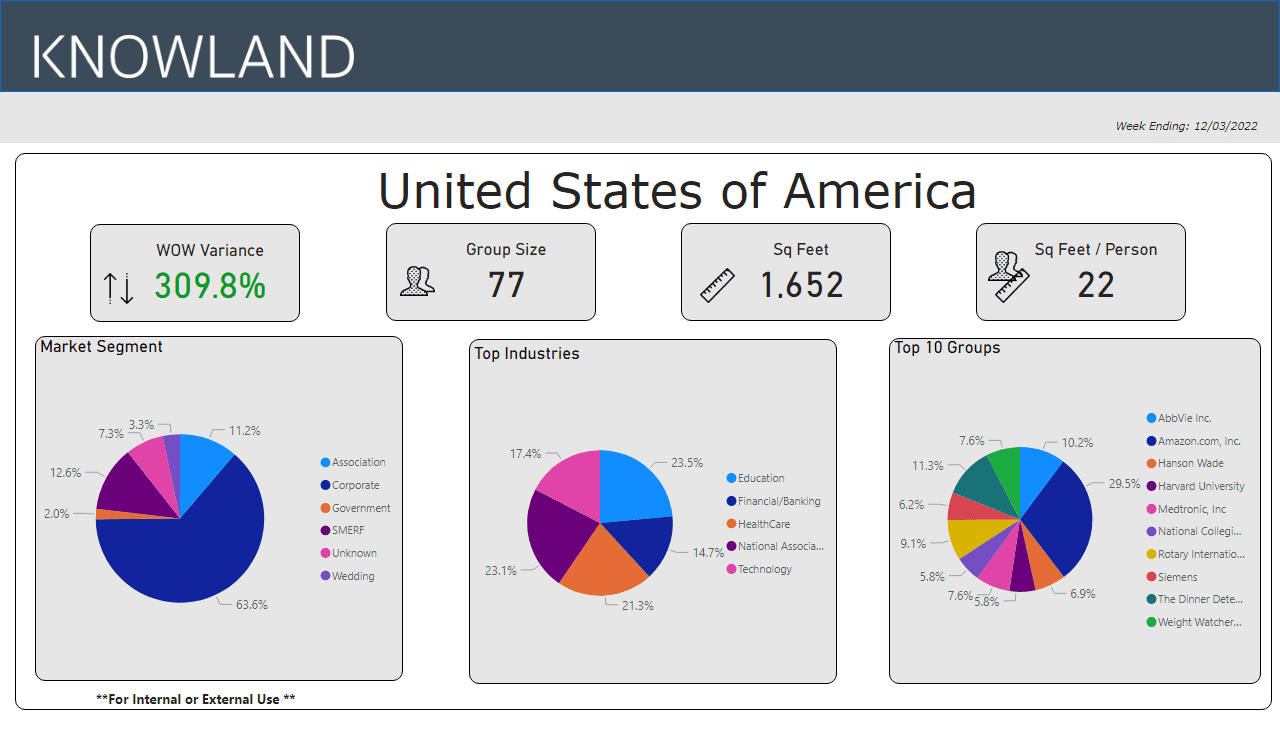
The number of U.S. meetings and events increased 309.8% compared to the prior week, showing a nice rebound after the Thanksgiving holiday. The increase reflects normal business trends as companies rush to finish business, finalize budgets, and meet with clients before the end of the year.

Ready to see what is happening in your market today? Schedule a free market analysis to find out.

The average number of attendees for the week was 77 (compared to 71 last week), while the average square footage used was 1,652 (compared to  1,425) per event and square feet used per person returned to 22 (compared to 20).

Dec 3 week trends

While the corporate market segment rebounded to a strong 63.6% (vs 44.6% last week) of overall meetings business for the week. The top five segments for the week were: Education, National Association, Healthcare, Technology and Financial/Banking.

In this strong rebound week after the holiday weekend, the top movers and shakers were: Atlanta, Phoenix, Washington DC, Chicago, and Boston.

Market Average Group Size Average Sq Ft Used
Atlanta, GA 85 1,852
Phoenix, AZ 100 2,429
Washington DC 93 1,962
Chicago, IL 70 1,440
Boston, MA 70 1,585

These numbers and markets change weekly based on market dynamics and social trends.

Knowland tracks the weekly event activity across 128 U.S. markets with more globally and is expanding coverage regularly.

Talk to a Knowland data expert today for sneak peek at your market trends.

Category iconHot Data Trends Tag iconWeekly Group Business Trends

Footer

  • Solutions
    • Hotel Properties
    • Above Property Management
    •   – Portfolio Capture
    •   – Market Analytics
    • Convention Centers and Other Venues
    • Features & Pricing
    • Demo Request >
  • Resources
    • Meetings Recovery Forecast
    • Success Stories
    • White Papers & Datasheets
    • Webcasts & Events
    • Blog
    • Glossary
  • Customers
    • Customer Sign In >
    • Support & Training
    • Billing Inquiries >
  • About Us
    • Meet Knowland
    • Culture
    • Job Openings
    • Press & Media
    • Sustainability
    • Contact Us >

LinkedIn Profile Twitter Profile Facebook Profile

info@knowland.com

clientcare@knowland.com

202-312-5880

1735 N Lynn St. Suite 600
Arlington, VA 22209

Subscribe for news and updates

© 2004–2023 Knowland Group

Privacy Policy

Cookie Settings