• Skip to primary navigation
  • Skip to main content
  • Skip to primary sidebar
  • Skip to footer
Knowland

Knowland

  • Solutions
    • Hotel Properties
    • Above Property Management
      • Portfolio Capture
      • Market Analytics
    • Convention Centers and Other Venues
    • Features & Pricing
  • Resources
    • Meetings Recovery Forecast
    • Success Stories
    • White Papers & Datasheets
    • Webcasts & Events
    • Blog
    • Sales Calculator
    • Glossary
  • Customers
    • Customer Sign In >
    • Support & Training
    • Billing Inquiries >
  • About Us
    • Meet Knowland
    • Culture
    • Job Openings
    • Press & Media
    • Sustainability
    • Contact Us
  • Support
  • Sign In
  • Try for Free
  • Request a Demo
  • Support
  • Sign In >
TRY FOR FREE REQUEST DEMO

Weekly Group Business Trends, Week Ending March 11, 2023

March 15, 2023

Las Vegas is catching up, #2 top growth market for the week

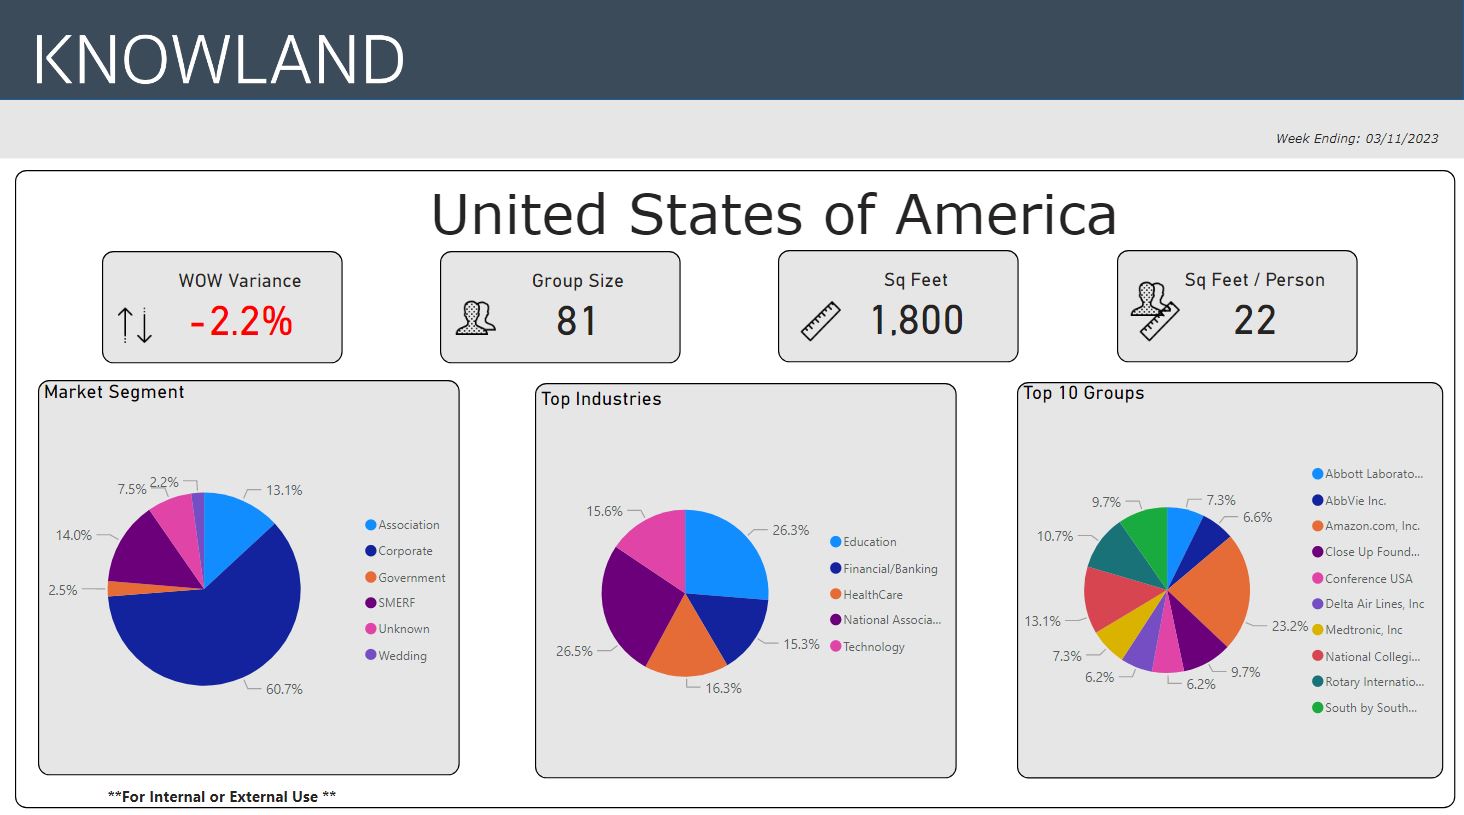
For the week ending March 11, 2023, the number of U.S. meetings and events decreased 2.2% compared to the prior week. Corporate events lead event volume with 60.7% of meetings and events, with Anaheim-Santa Ana leading this week’s market movers and shakers.

Ready to see what is happening in your market today? Schedule a free market analysis to find out.

The average number of attendees for the week was 81 (compared to 82 last week), while the average square footage used was 1,800 (compared to 1,858) per event, and square feet used per person was 22.

The top five segments for the week were: National Association, Education, Healthcare, Technology, and Finance/Banking.

The top growth market movers and shakers were: Anaheim-Santa Ana, Las Vegas, LA-Long Beach, Boston, and Albuquerque and New Orleans (tied for 5th place).

Market Average Group Size Average Sq Ft Used
Anaheim – Santa Ana, CA 76 1,288
Las Vegas, NV 99 2,580
Los Angeles – Long Beach 69 1,496
Boston, MA 72 1,612
Albuquerque, NM
Las Vega, NV
47
137
956
3,644

These numbers and markets change weekly based on market dynamics and social trends.

Knowland tracks the weekly event activity across 128 U.S. markets with more globally and is expanding coverage regularly.

Talk to a Knowland data expert today for sneak peek at your market trends.

Category iconHot Data Trends Tag iconWeekly Group Business Trends

Primary Sidebar

Footer

  • Solutions
    • Hotel Properties
    • Above Property Management
    •   – Portfolio Capture
    •   – Market Analytics
    • Convention Centers and Other Venues
    • Features & Pricing
    • Try for Free >
    • Demo Request >
  • Resources
    • Meetings Recovery Forecast
    • Success Stories
    • White Papers & Datasheets
    • Webcasts & Events
    • Blog
    • Sales Calculator
    • Glossary
  • Customers
    • Customer Sign In >
    • Support & Training
    • Billing Inquiries >
  • About Us
    • Meet Knowland
    • Culture
    • Job Openings
    • Press & Media
    • Sustainability
    • Contact Us >

LinkedIn Profile Twitter Profile Facebook Profile

info@knowland.com

clientcare@knowland.com

202-312-5880

2300 Wilson Blvd. Ste 700 Arlington, VA 22201

Subscribe for news and updates

© 2004–2023 Knowland Group

Privacy Policy

Cookie Settings