• Skip to primary navigation
  • Skip to main content
  • Skip to primary sidebar
  • Skip to footer
Knowland

Knowland

  • Solutions
    • Hotel Properties
      • Knowland Classic
      • Knowland Select
    • Above Property Management
      • Portfolio Capture
      • Market Analytics
    • CVBs and DMOs
    • Features & Pricing
  • Resources
    • Hospitality Group & Business Performance Index
    • Success Stories
    • White Papers & Datasheets
    • Webcasts & Events
    • Blog
    • Sales Calculator
    • Glossary
  • Customers
    • Customer Sign In >
    • Support & Training
    • Billing Inquiries >
  • About Us
    • Meet Knowland
    • Culture
    • Job Openings
    • Press & Media
    • Sustainability
    • Contact Us
  • Support
  • Sign In
  • Try for Free
  • Request a Demo
  • Support
  • Sign In >
TRY FOR FREE REQUEST DEMO

Weekly Group Business Trends, Week Ending March 25, 2023

March 29, 2023

San Antonio leads the pack of this week’s movers and shakers

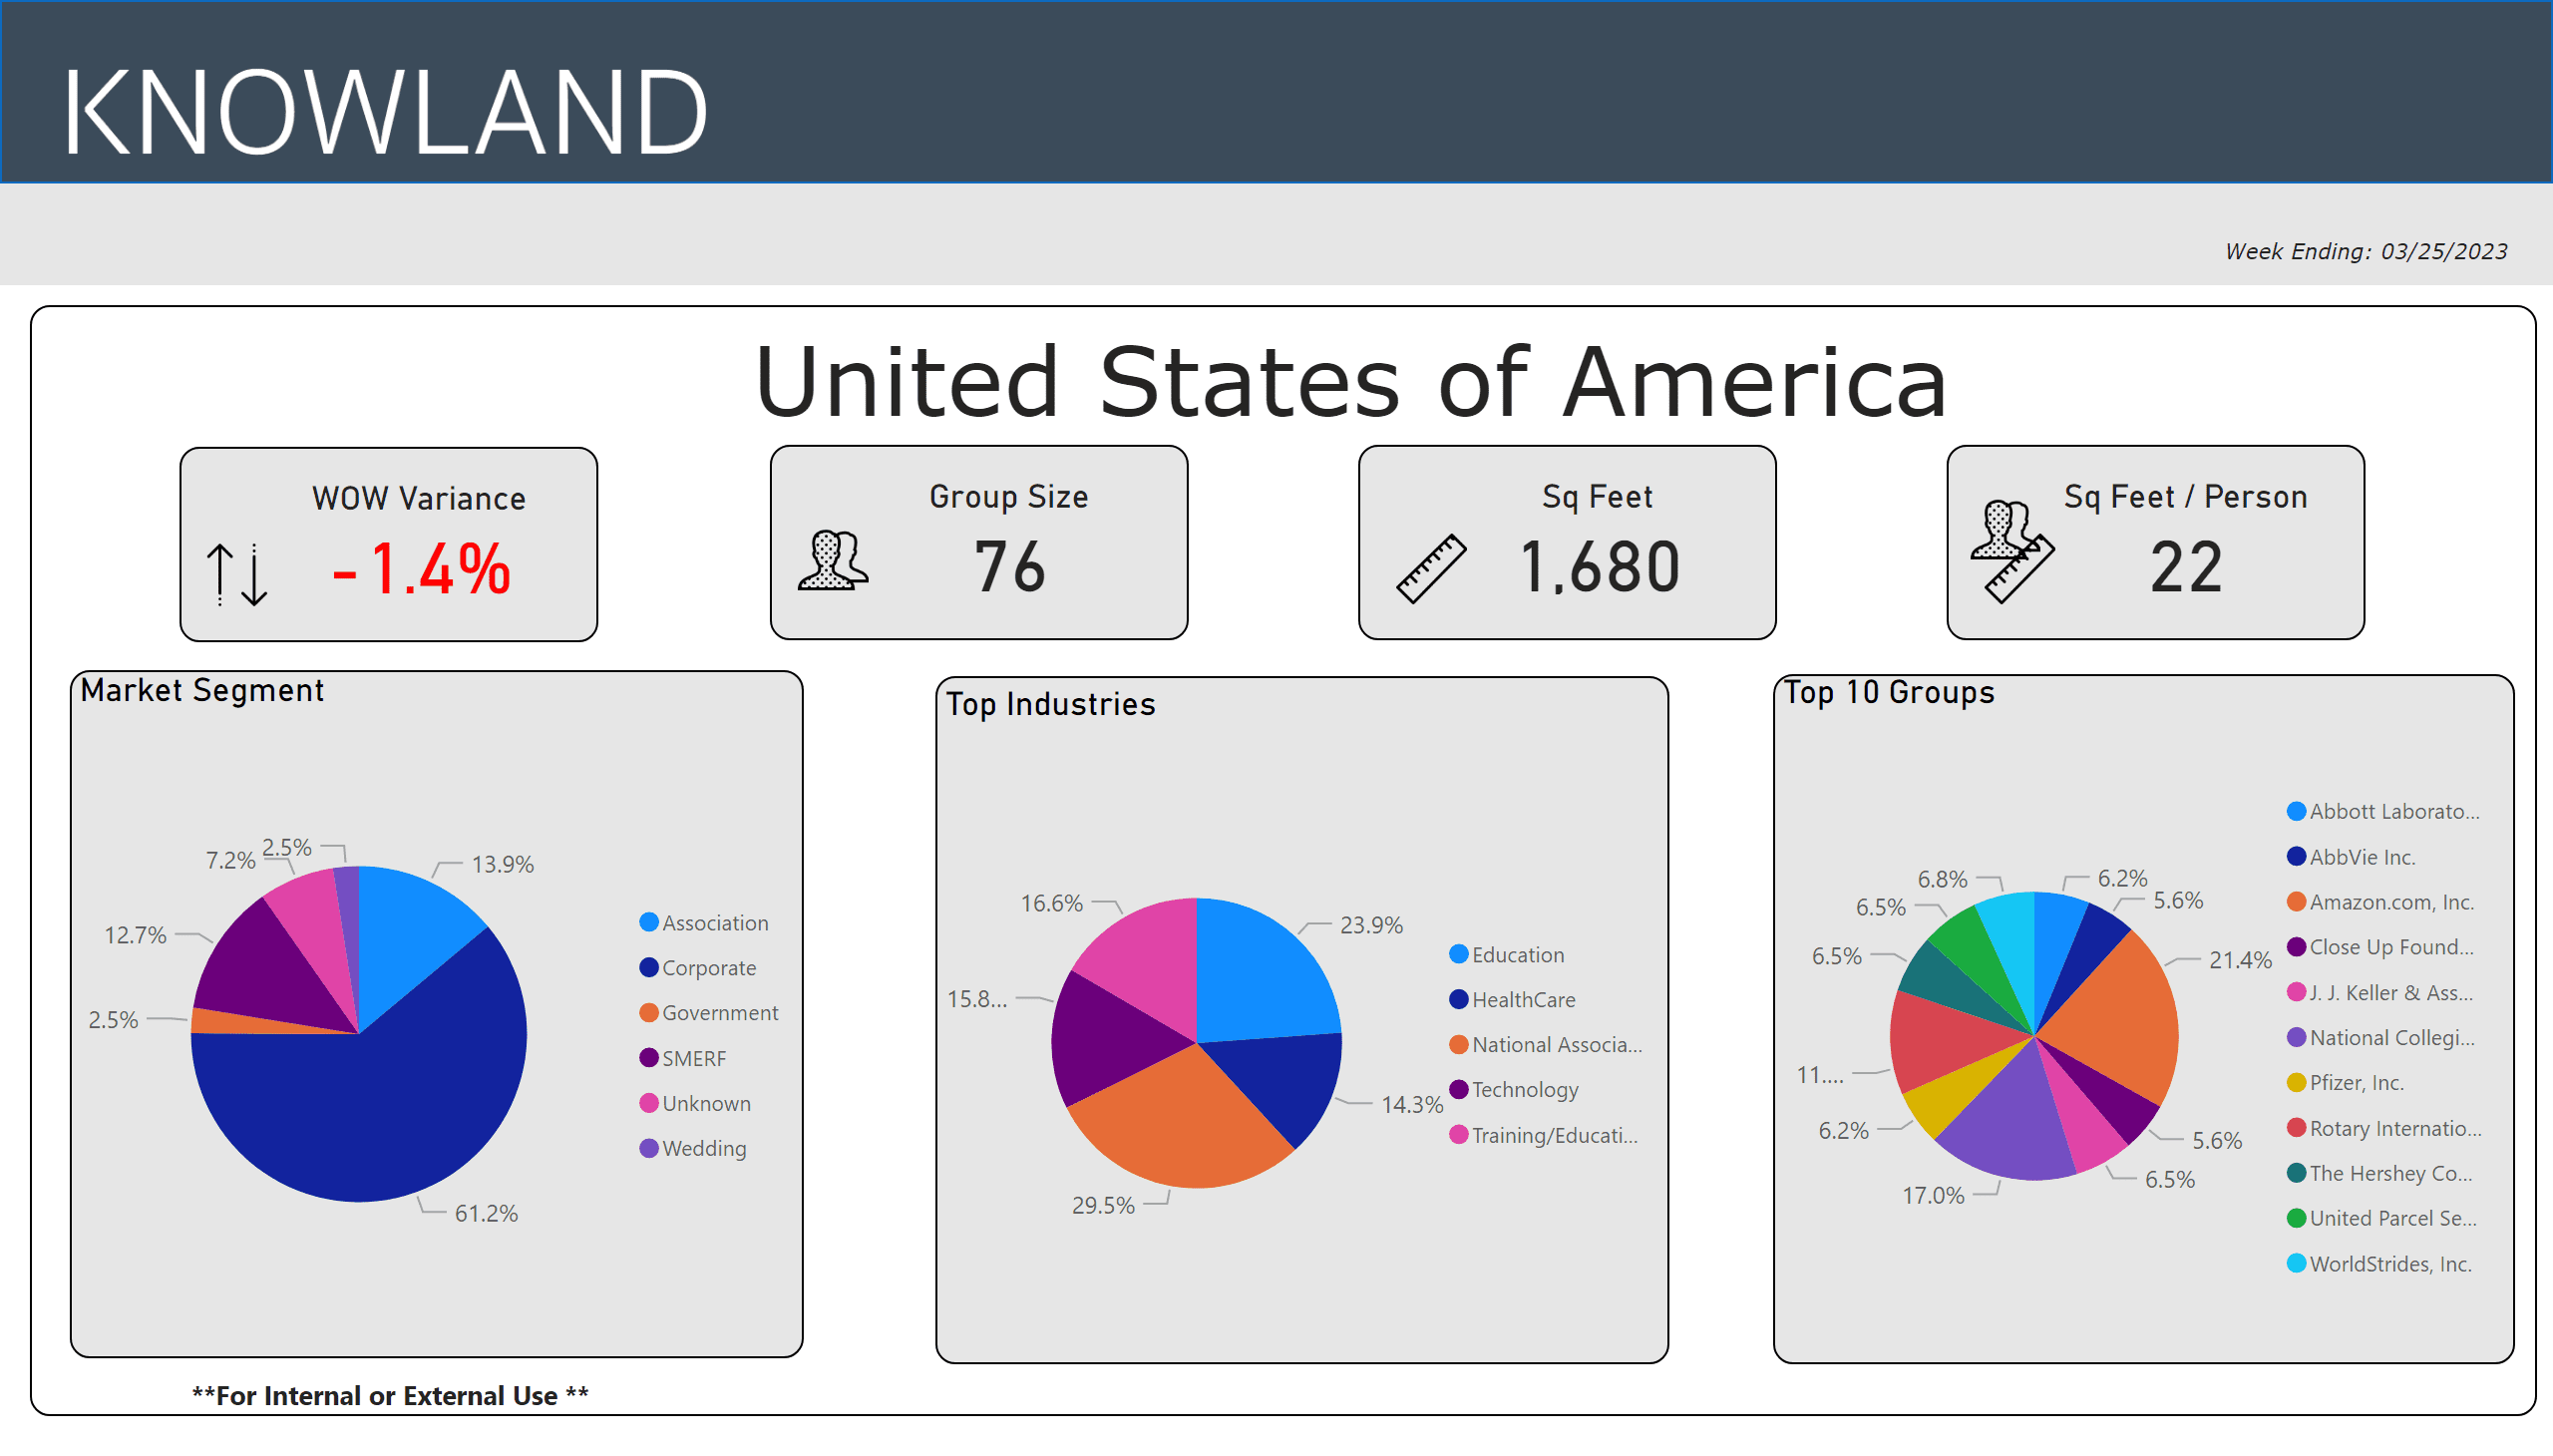
For the week ending March 25, 2023, the number of U.S. meetings and events decreased 1.4% compared to the prior week, in line with seasonality trends for Spring. Corporate events lead event volume with 61.2% of meetings and events, with National Association groups again as the top industry segment for the week.

Ready to see what is happening in your market today? Schedule a free market analysis to find out.

The average number of attendees for the week was 76 (compared to 80 last week), while the average square footage used was 1,680 (compared to 1,712) per event, and square feet used per person was 22.

Hot data 3-25-23

The top five segments for the week were: National Association, Education, Training/Education, Technology and Healthcare.

The top growth market movers and shakers were: San Antonio, Austin, Houston, Minneapolis-St. Paul, and Dallas.

Market Average Group Size Average Sq Ft Used
San Antonio, TX 56 1,395
Austin, TX 79 1,704
Houston, TX 69 1,786
Minneapolis-St. Paul, MN-WI 58 1,103
Dallas, TX 81 1,904

These numbers and markets change weekly based on market dynamics and social trends.

Knowland tracks the weekly event activity across 128 U.S. markets with more globally and is expanding coverage regularly.

Talk to a Knowland data expert today for sneak peek at your market trends.

Category iconHot Data Trends Tag iconWeekly Group Business Trends

Primary Sidebar

Footer

  • Solutions
    • Hotel Properties
    •   – Knowland Classic
    •   – Knowland Select
    • Above Property Management
    •   – Portfolio Capture
    •   – Market Analytics
    • CVBs and DMOs
    • Features & Pricing
    • Try for Free >
    • Demo Request >
  • Resources
    • Hospitality Group & Business Performance Index
    • Success Stories
    • White Papers & Datasheets
    • Webcasts & Events
    • Blog
    • Sales Calculator
    • Glossary
  • Customers
    • Customer Sign In >
    • Support & Training
    • Billing Inquiries >
  • About Us
    • Meet Knowland
    • Culture
    • Job Openings
    • Press & Media
    • Sustainability
    • Contact Us >

[email protected]

[email protected]

202-312-5880

2300 Wilson Blvd. Ste 700 Arlington, VA 22201

Subscribe for news and updates

© 2004–2025 Knowland Group

Privacy Policy

Cookie Settings