• Skip to primary navigation
  • Skip to main content
  • Skip to primary sidebar
  • Skip to footer
Knowland

Knowland

  • Solutions
    • Hotel Properties
    • Above Property Management
      • Portfolio Capture
      • Market Analytics
    • Convention Centers and Other Venues
    • Features & Pricing
  • Resources
    • Meetings Recovery Forecast
    • Success Stories
    • White Papers & Datasheets
    • Webcasts & Events
    • Blog
    • Sales Calculator
    • Glossary
  • Customers
    • Customer Sign In >
    • Support & Training
    • Billing Inquiries >
  • About Us
    • Meet Knowland
    • Culture
    • Job Openings
    • Press & Media
    • Sustainability
    • Contact Us
  • Support
  • Sign In
  • Try for Free
  • Request a Demo
  • Support
  • Sign In >
TRY FOR FREE REQUEST DEMO

Weekly Group Meetings and Events Stats, Week Ending April 22, 2023

April 26, 2023

Meetings and events grow at 27% week over week with top markets shining through

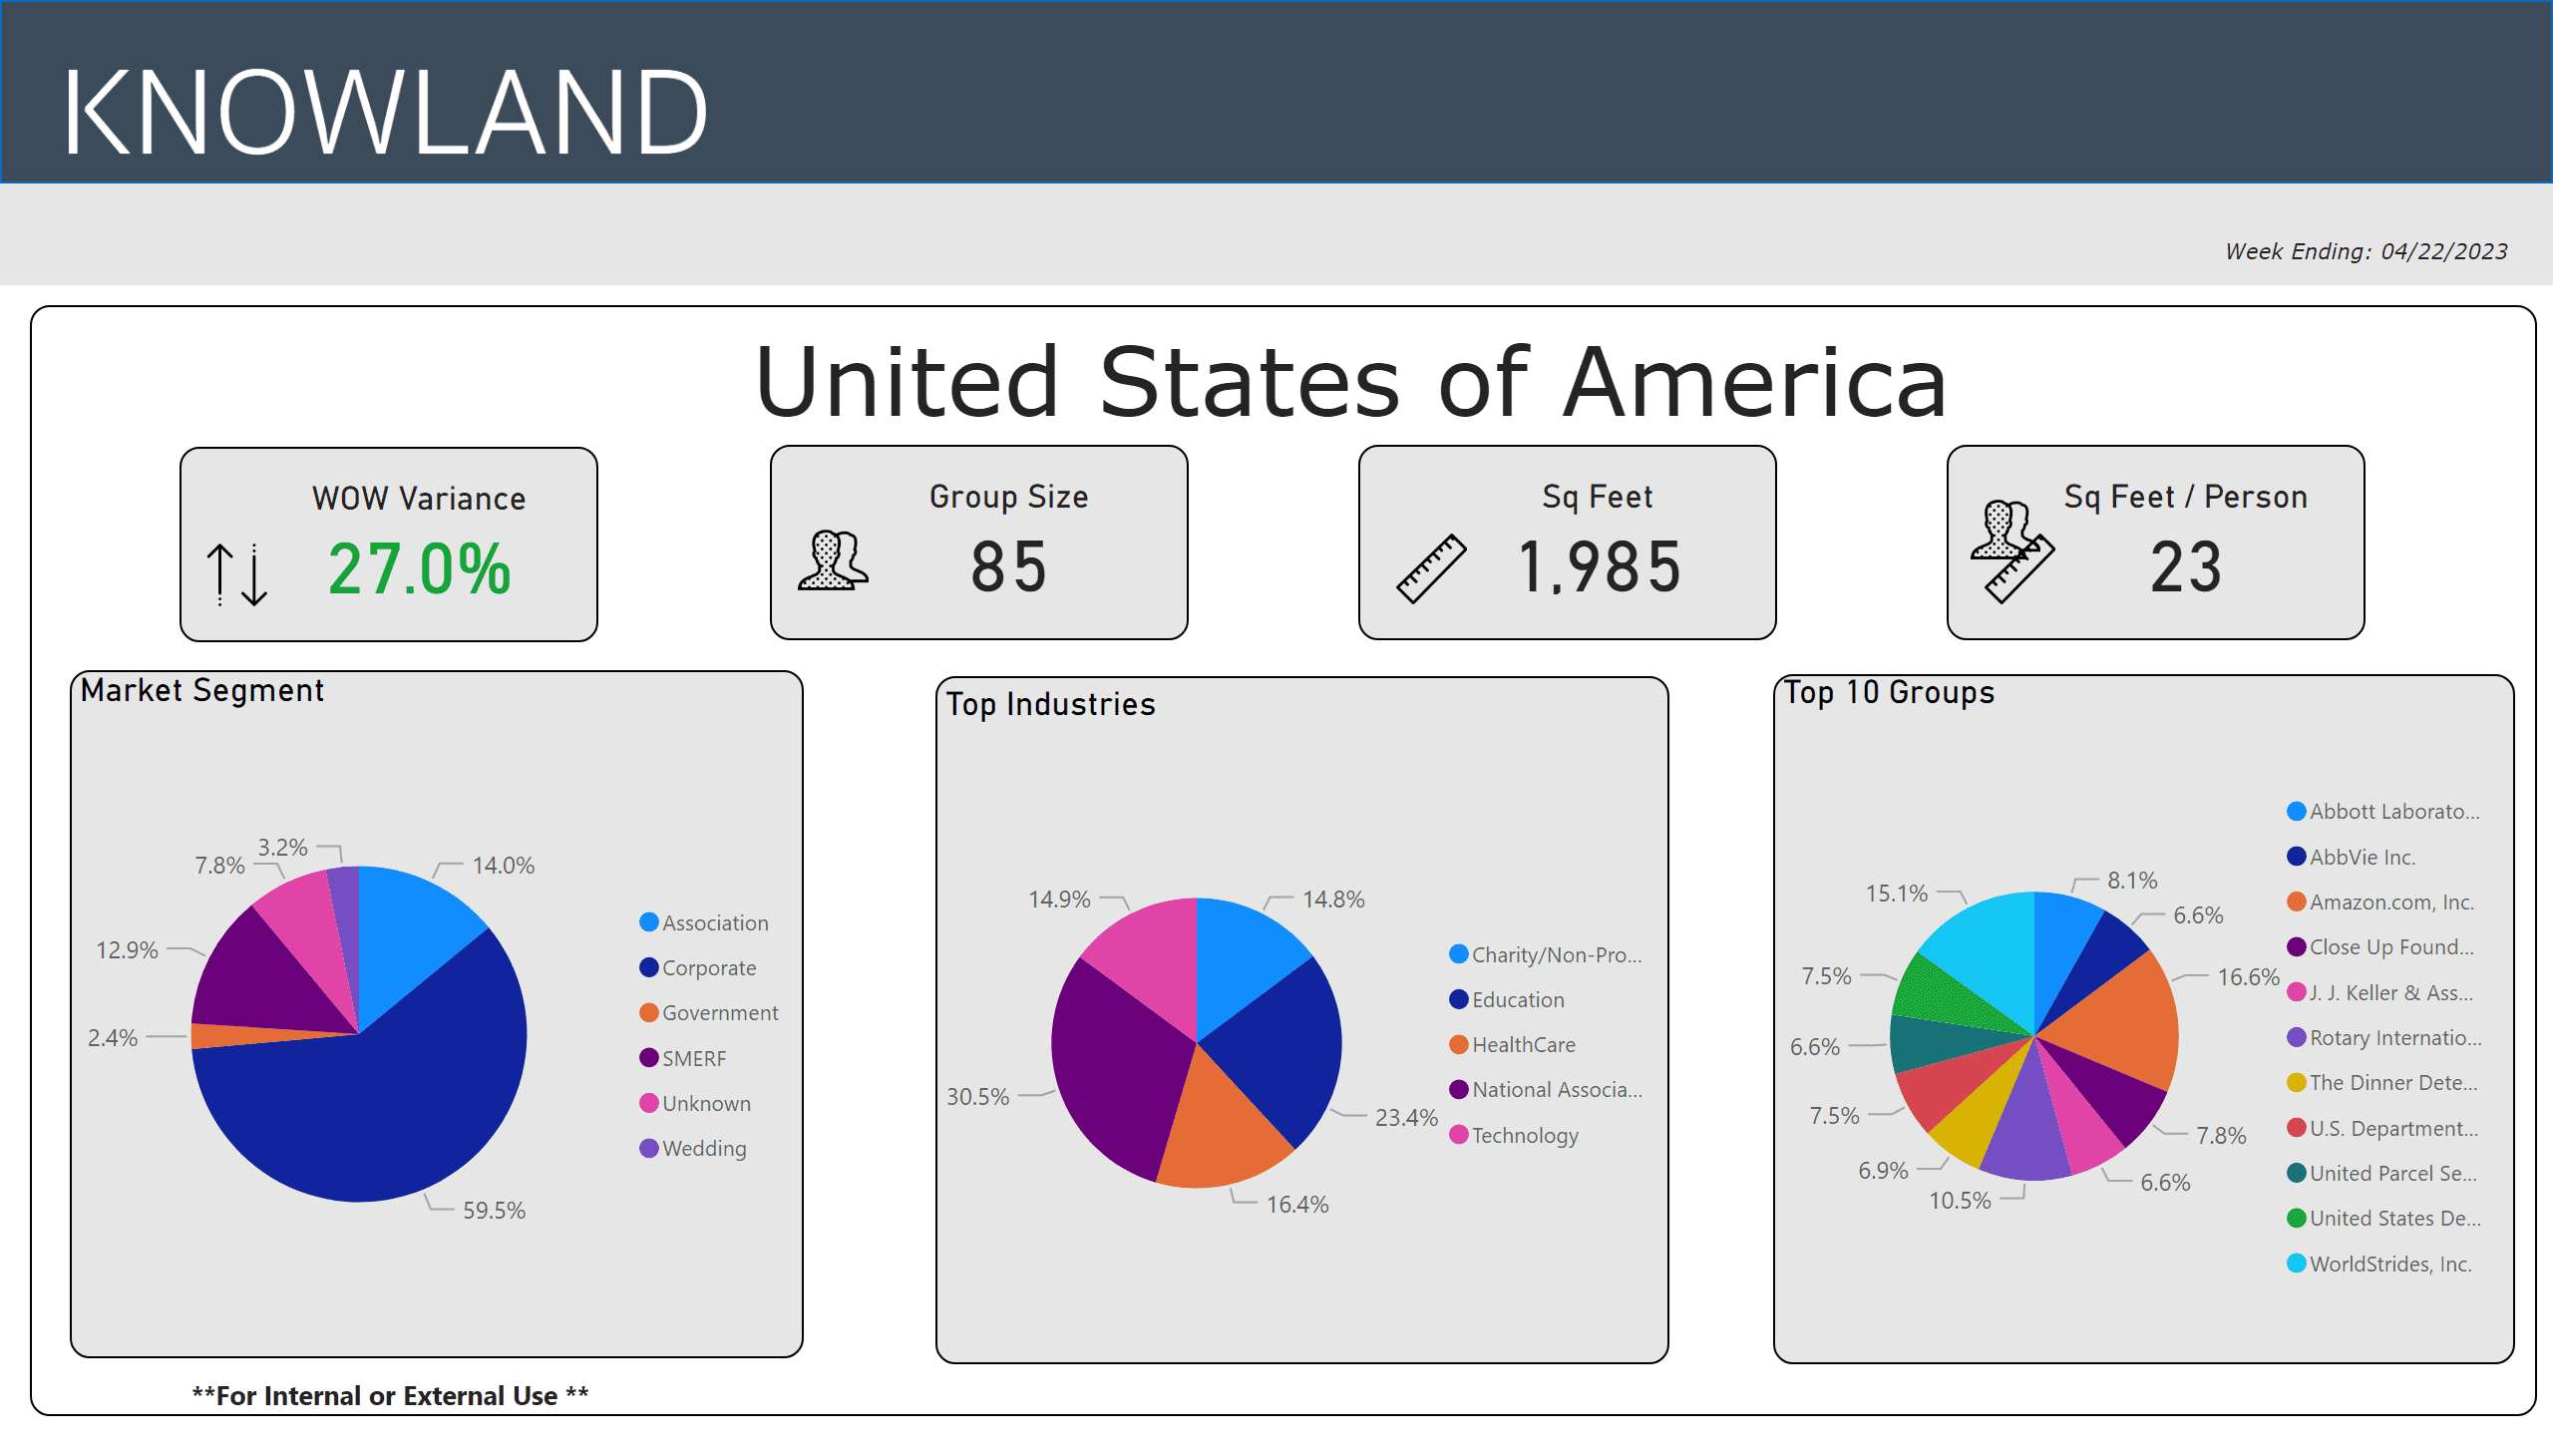
For the week ending April 22, 2023, the number of U.S. meetings and events increased 27.4% compared to the prior week. This performance shows continued momentum for gatherings as we move into spring and summer.  Corporate events lead event volume with 59.5% of meetings and events, with National Association groups as the top industry segment for the week.

Ready to see what is happening in your market today? Schedule a free market analysis to find out.

The average number of attendees for the week was steady at 87 (compared to 75 last week), while the average square footage used was up to 1,985 (compared to 1,656) per event, and square feet used per person was up to 23.

4-22-23 weekly meeting stats

Technology makes its way back into the top industry segments this week. The top five segments for the week were: National Association, Education, Healthcare, Technology and Charity/Non-Profit/Social Services.

The top growth market movers and shakers were: Washington DC, Orlando, Los Angeles-Long Beach, Chicago, and San Diego.

Market Average Group Size Average Sq Ft Used
Washington DC-MD-VA 100 2,232
Orlando, FL 94 2,374
Los Angeles-Long Beach, CA 84 1,869
Chicago, IL 69 1,720
San Diego, CA 119 3,069

These numbers and markets change weekly based on market dynamics and social trends.

Knowland tracks the weekly event activity across 128 U.S. markets with more globally and is expanding coverage regularly.

Talk to a Knowland data expert today for sneak peek at your market trends.

Category iconHot Data Trends Tag iconMeetings and Events Stats,  Weekly Group Business Trends

Primary Sidebar

Footer

  • Solutions
    • Hotel Properties
    • Above Property Management
    •   – Portfolio Capture
    •   – Market Analytics
    • Convention Centers and Other Venues
    • Features & Pricing
    • Try for Free >
    • Demo Request >
  • Resources
    • Meetings Recovery Forecast
    • Success Stories
    • White Papers & Datasheets
    • Webcasts & Events
    • Blog
    • Sales Calculator
    • Glossary
  • Customers
    • Customer Sign In >
    • Support & Training
    • Billing Inquiries >
  • About Us
    • Meet Knowland
    • Culture
    • Job Openings
    • Press & Media
    • Sustainability
    • Contact Us >

LinkedIn Profile Twitter Profile Facebook Profile

info@knowland.com

clientcare@knowland.com

202-312-5880

2300 Wilson Blvd. Ste 700 Arlington, VA 22201

Subscribe for news and updates

© 2004–2023 Knowland Group

Privacy Policy

Cookie Settings