• Skip to primary navigation
  • Skip to main content
  • Skip to primary sidebar
  • Skip to footer
Knowland

Knowland

  • Solutions
    • Hotel Properties
      • Knowland Classic
      • Knowland Select
    • Above Property Management
      • Portfolio Capture
      • Market Analytics
    • CVBs and DMOs
    • Features & Pricing
  • Resources
    • Hospitality Group & Business Performance Index
    • Success Stories
    • White Papers & Datasheets
    • Webcasts & Events
    • Blog
    • Sales Calculator
    • Glossary
  • Customers
    • Customer Sign In >
    • Support & Training
    • Billing Inquiries >
  • About Us
    • Meet Knowland
    • Culture
    • Job Openings
    • Press & Media
    • Sustainability
    • Contact Us
  • Support
  • Sign In
  • Try for Free
  • Request a Demo
  • Support
  • Sign In >
TRY FOR FREE REQUEST DEMO

Weekly Group Meetings and Events Stats, Week Ending May 27, 2023

June 1, 2023

Meetings slow for the holiday week as summer kicks off

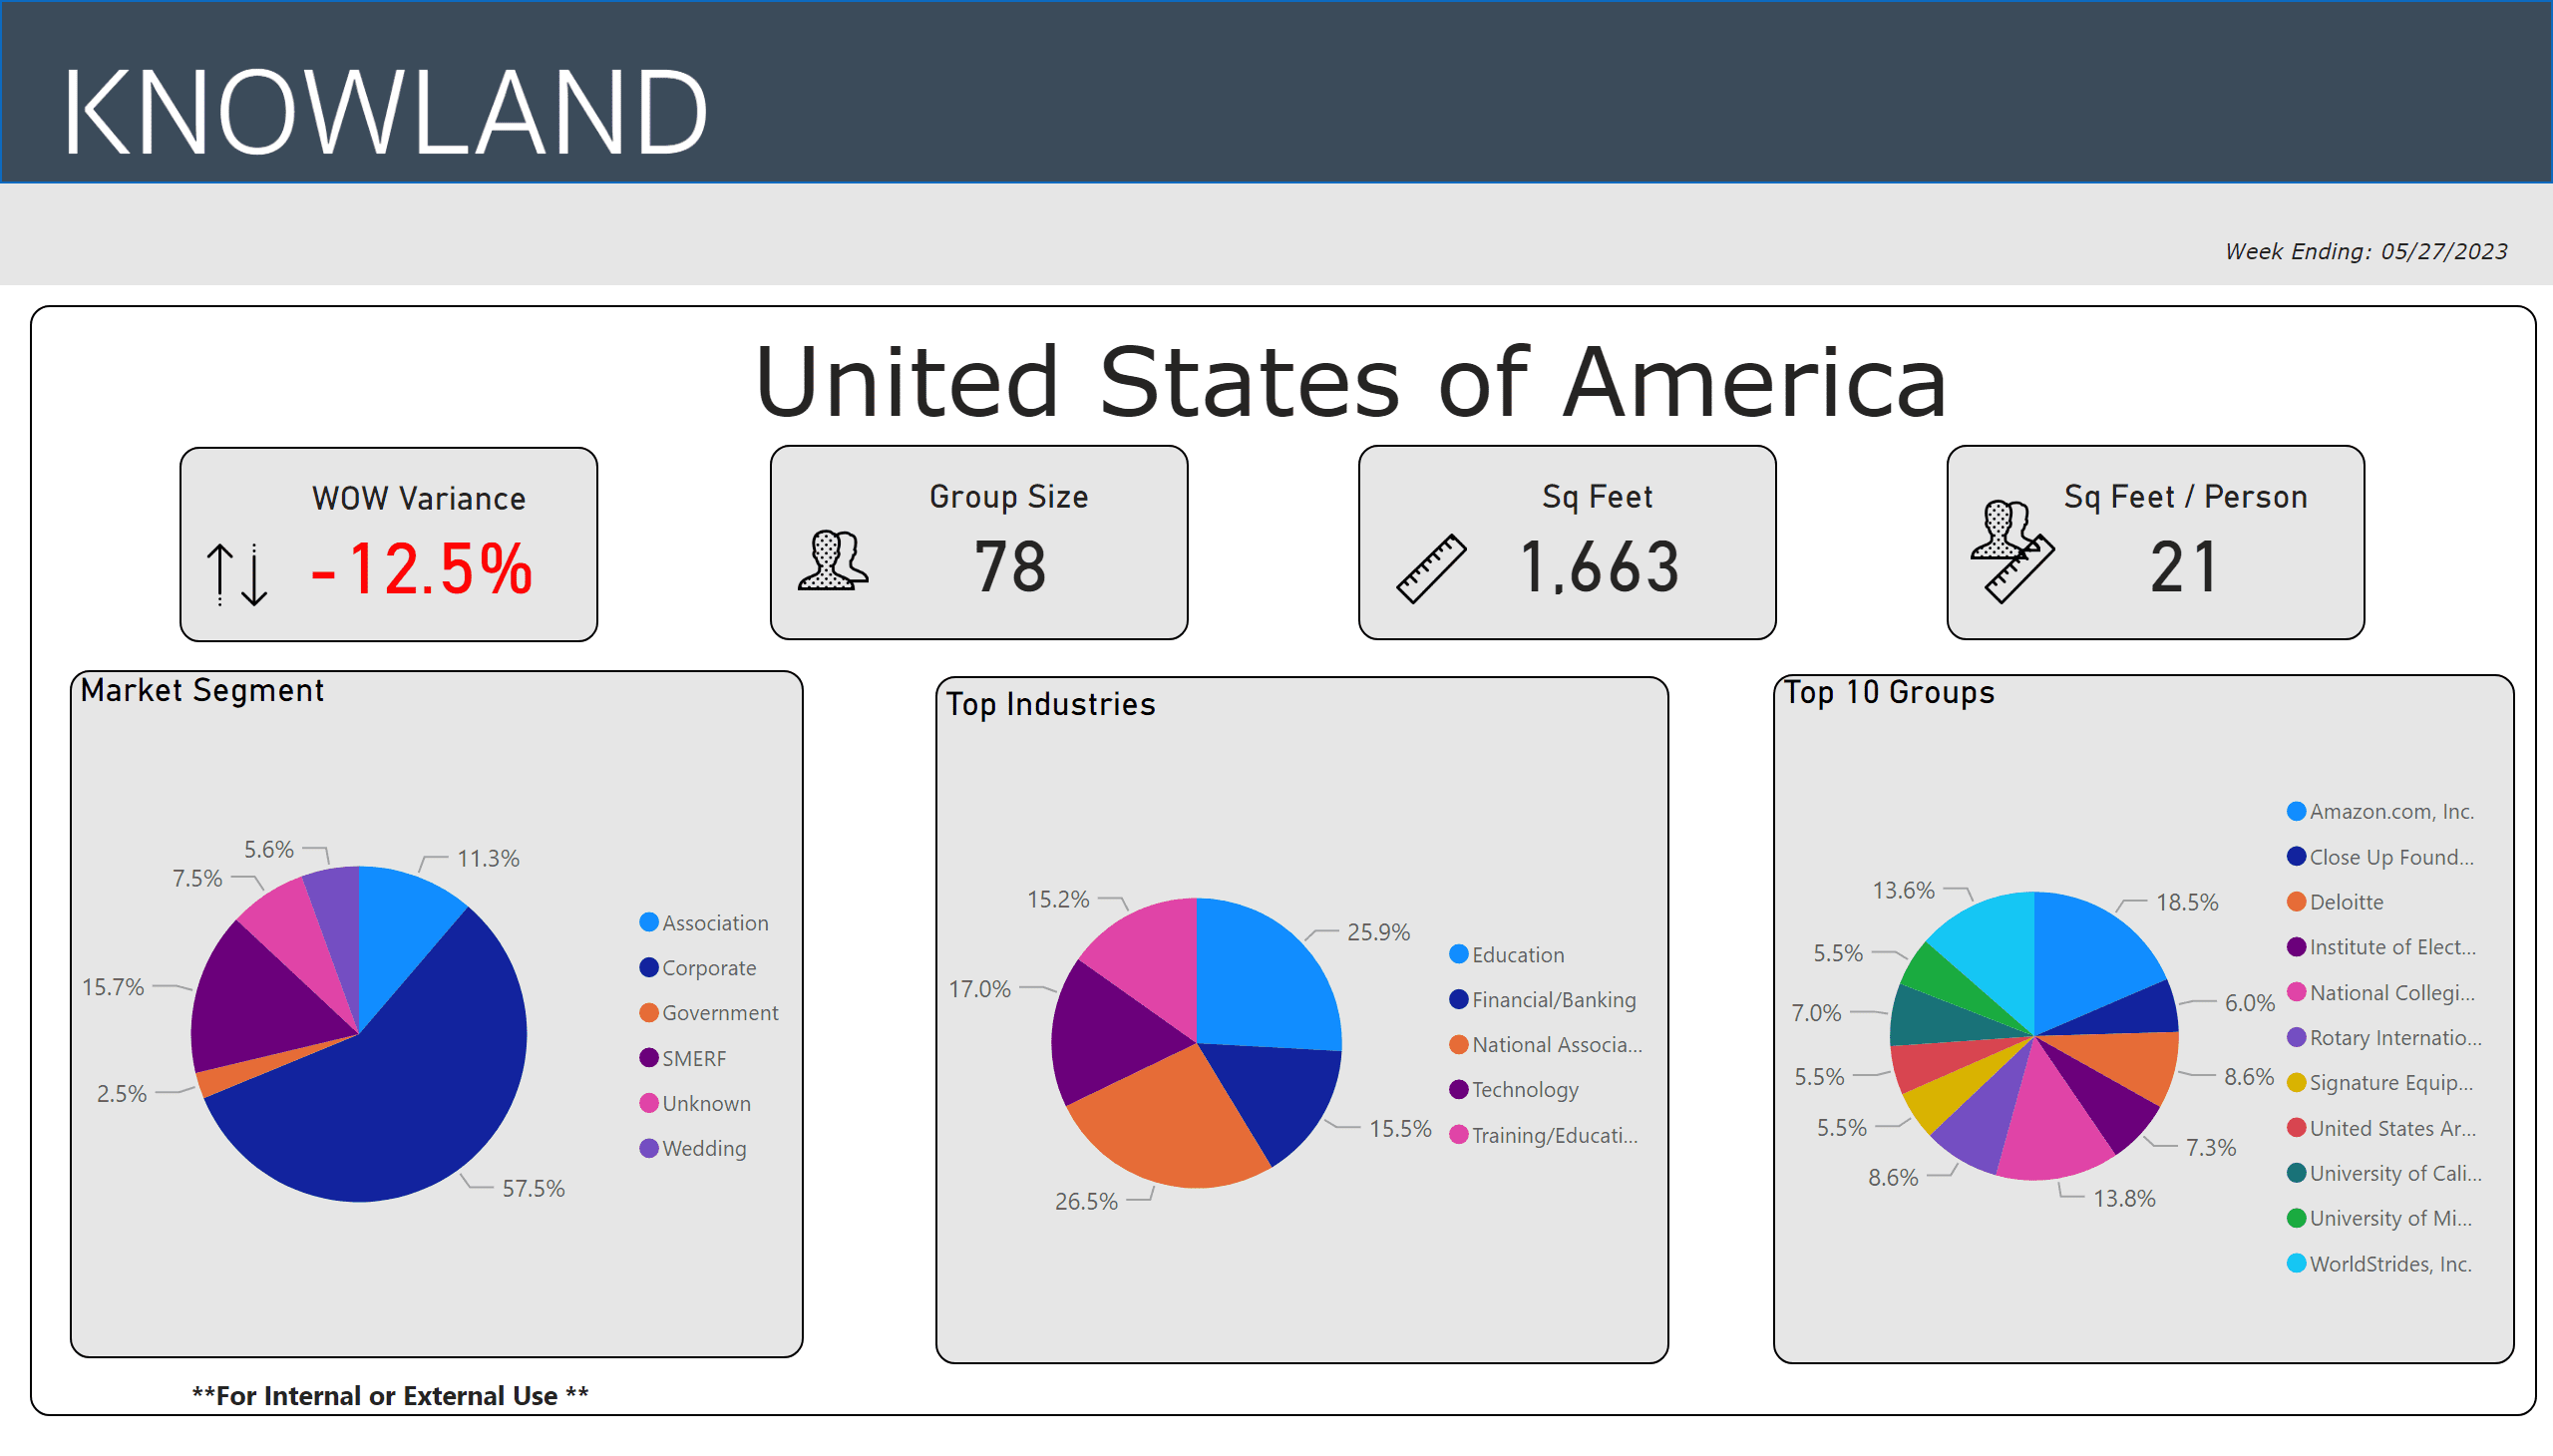
For the week ending May 27, 2023, the number of U.S. meetings and events decreased 12.5% compared to the prior week. These trends are consistent with seasonal trends for the week of the long Memorial Day holiday weekend. Corporate events lead event volume with 57.5% of meetings and events, with National Association groups as the top industry segment for the week, closely followed by the Education segment.

Portland had the highest growth week over week, and of the top mover and shaker markets Maui had the highest average number of attendees.

Ready to see what is happening in your market today? Schedule a free market analysis to find out.

The average number of attendees for the week was steady at 78 (compared to 80 last week), while the average square footage used was up to 1,850 (compared to 1,663) per event, and square feet used per person was 21.

5-27-23 Week Hot Trends

The top five segments for the week were: National Association, Education, Technology, Financial/Banking, and Training/Education.

The top growth market movers and shakers were: Portland, Sacramento, Tucson, Raleigh-Durham-Chapel Hill, and Maui Island.

Market Average Group Size Average Sq Ft Used
Portland, OR 76 1,316
Sacramento, CA 77 1,386
Tucson, AZ 96 3,058
Raleigh-Durham-Chapel Hill, NC 73 1,258
Maui Island, HI 99 2,636

These numbers and markets change weekly based on market dynamics and social trends.

Knowland tracks the weekly event activity across 166 U.S. markets with more globally and is expanding coverage regularly.

Talk to a Knowland data expert today for sneak peek at your market trends.

Category iconHot Data Trends Tag iconMeetings and Events Stats,  Weekly Group Business Trends

Primary Sidebar

Footer

  • Solutions
    • Hotel Properties
    •   – Knowland Classic
    •   – Knowland Select
    • Above Property Management
    •   – Portfolio Capture
    •   – Market Analytics
    • CVBs and DMOs
    • Features & Pricing
    • Try for Free >
    • Demo Request >
  • Resources
    • Hospitality Group & Business Performance Index
    • Success Stories
    • White Papers & Datasheets
    • Webcasts & Events
    • Blog
    • Sales Calculator
    • Glossary
  • Customers
    • Customer Sign In >
    • Support & Training
    • Billing Inquiries >
  • About Us
    • Meet Knowland
    • Culture
    • Job Openings
    • Press & Media
    • Sustainability
    • Contact Us >

[email protected]

[email protected]

202-312-5880

2300 Wilson Blvd. Ste 700 Arlington, VA 22201

Subscribe for news and updates

© 2004–2025 Knowland Group

Privacy Policy

Cookie Settings