• Skip to primary navigation
  • Skip to main content
  • Skip to primary sidebar
  • Skip to footer
Knowland

Knowland

  • Solutions
    • Hotel Properties
    • Above Property Management
      • Portfolio Capture
      • Market Analytics
    • CVBs and DMOs
    • Features & Pricing
  • Resources
    • Meetings Recovery Forecast
    • Hospitality Group & Business Performance Index
    • Success Stories
    • White Papers & Datasheets
    • Webcasts & Events
    • Blog
    • Sales Calculator
    • Glossary
  • Customers
    • Customer Sign In >
    • Support & Training
    • Billing Inquiries >
  • About Us
    • Meet Knowland
    • Culture
    • Job Openings
    • Press & Media
    • Sustainability
    • Contact Us
  • Support
  • Sign In
  • Try for Free
  • Request a Demo
  • Support
  • Sign In >
TRY FOR FREE REQUEST DEMO

Weekly Group Meetings and Events Stats, Week Ending July 1, 2023

July 5, 2023

National associations dominate as we head into the long summer holiday weekend

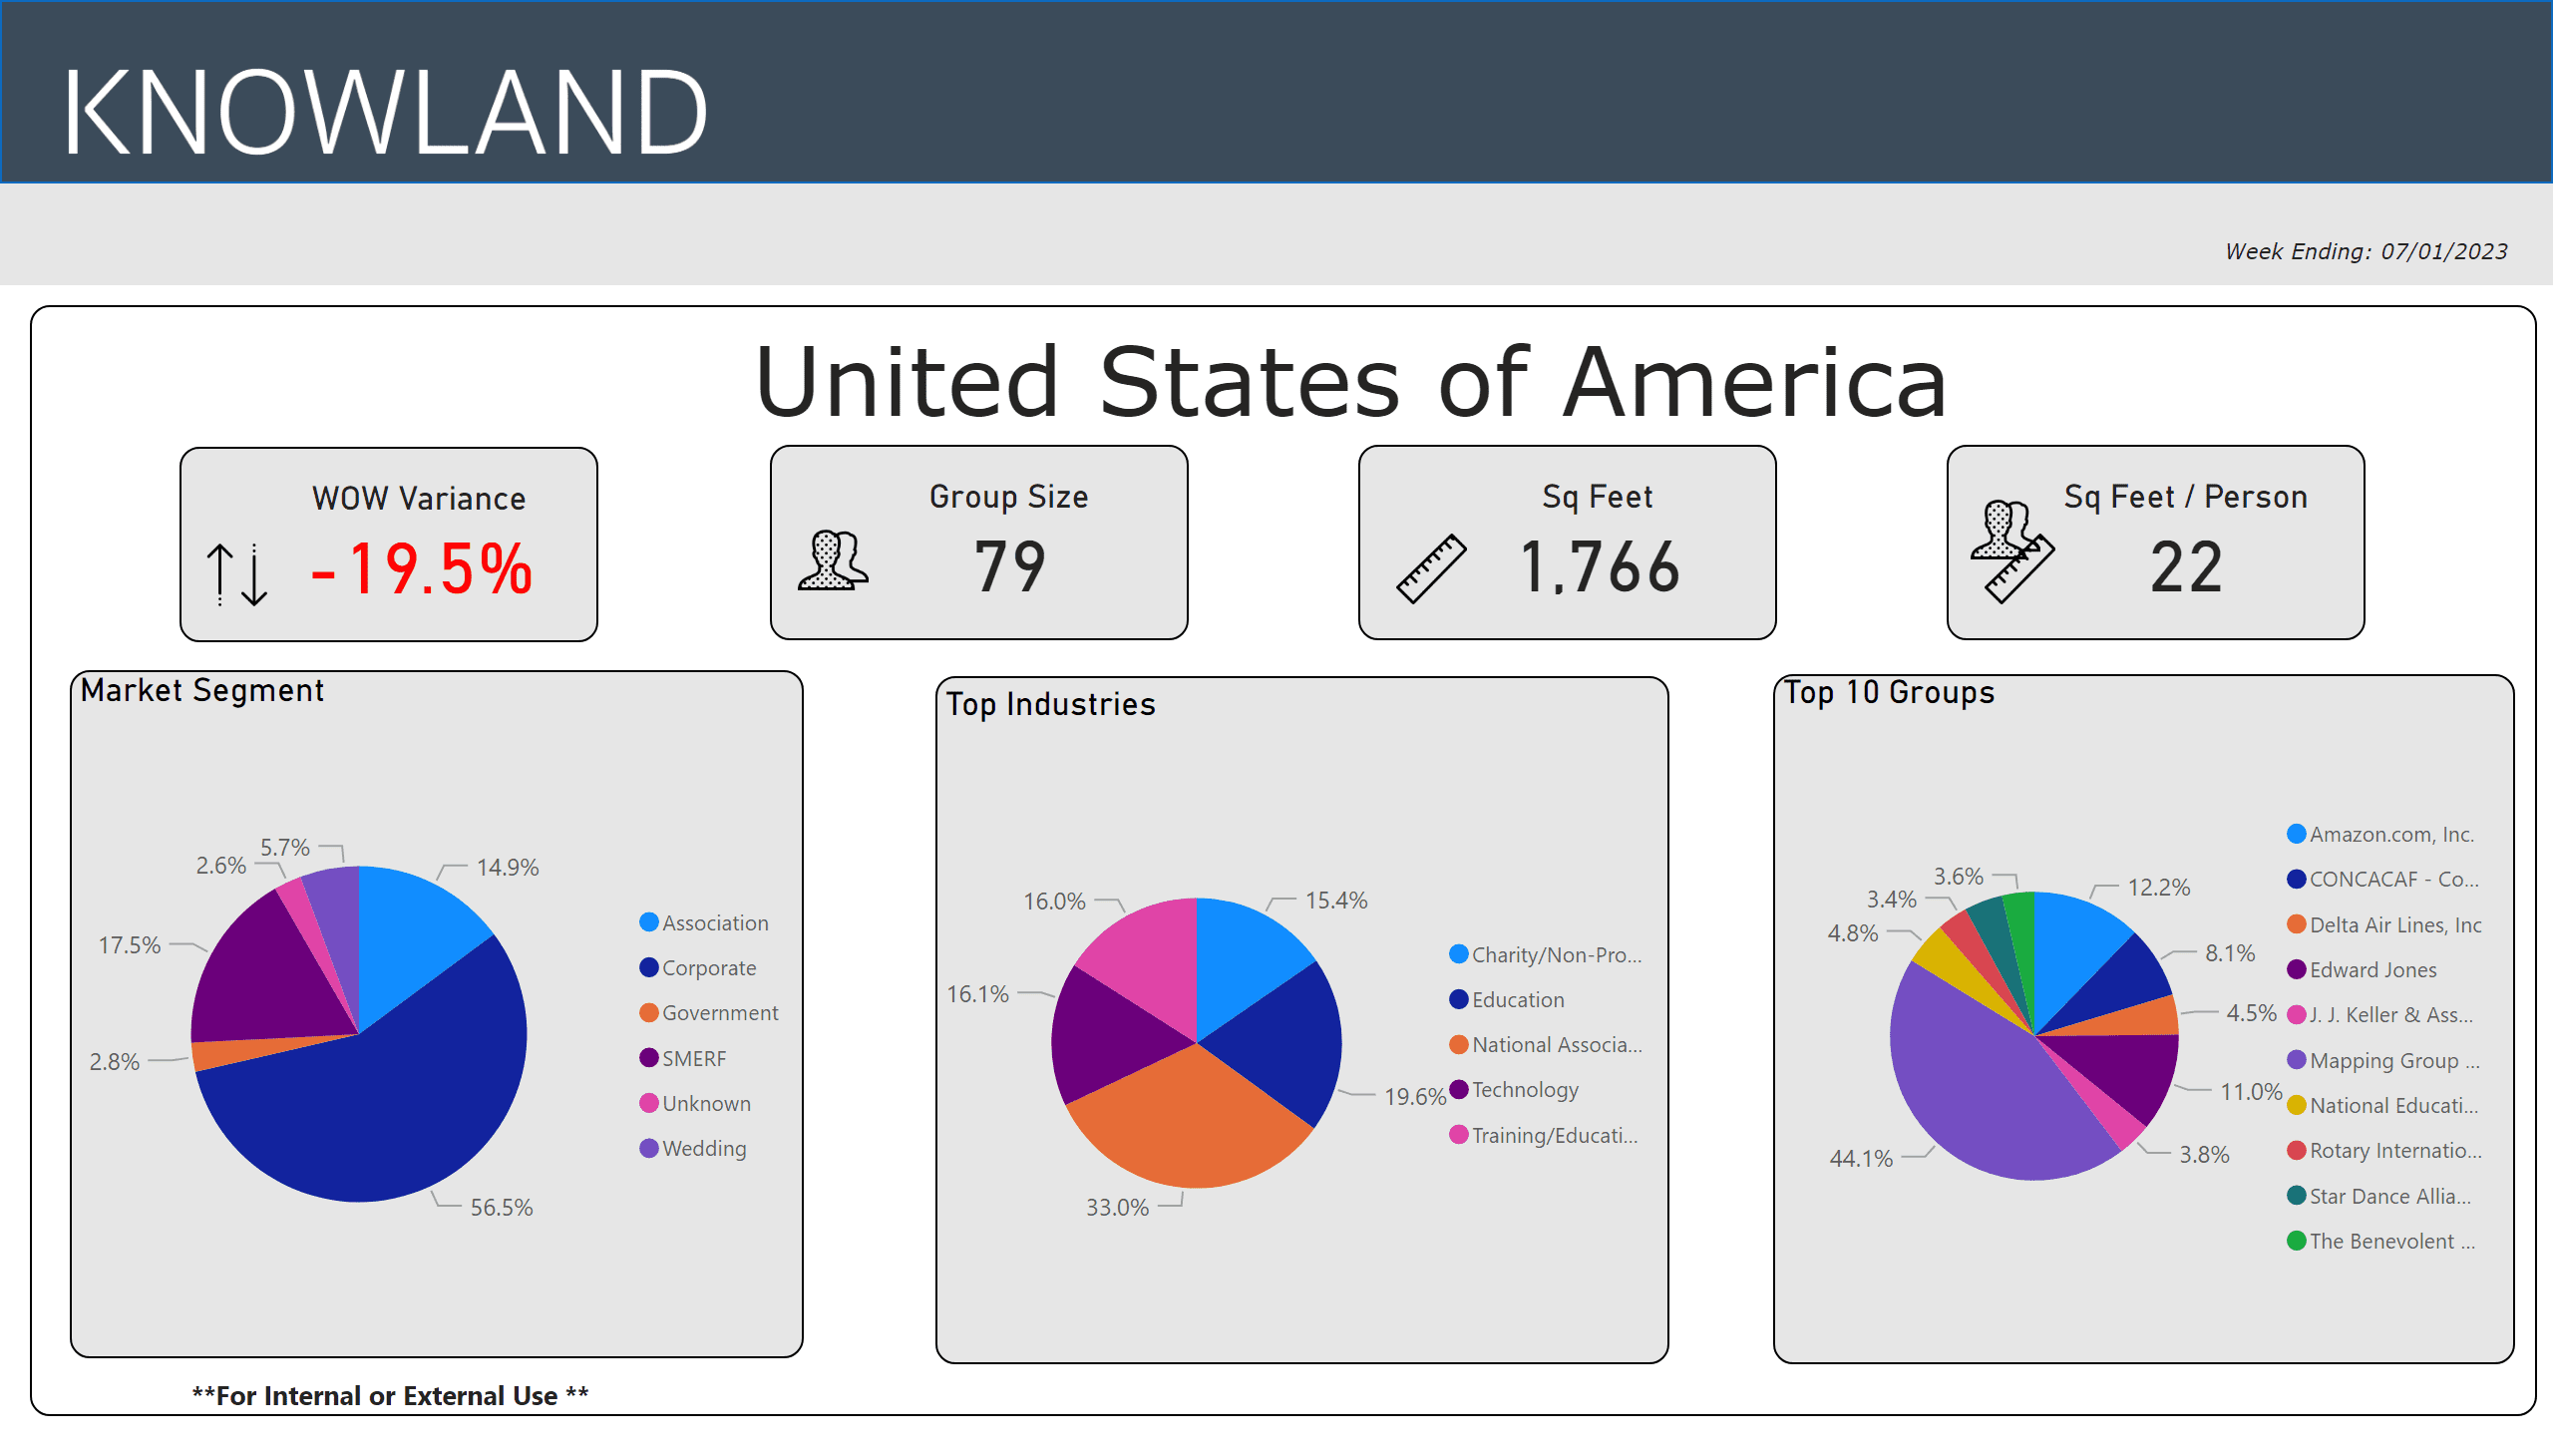
For the week ending July 1, 2023, the number of U.S. meetings and events dropped 19.5% compared to the prior week. These trends are consistent with upcoming long holiday weekend. Corporate events lead event volume with 56.5% of meetings and events, with National Associations driving the dominant industry share at 33.0% for the week, followed by the Education segment at 19.6%.

Ready to see what is happening in your market today? Schedule a free market analysis to find out.

The average number of attendees for the week was 79 (compared to 83 last week), while the average square footage used was 1,766 (compared to 1,890) per event, and square feet used per person was 22.

Hot trends 7-1-23

The top five segments for the week were: National Association, Education, Technology, Training/Education and Charity/Non-Profit/Social Services.

The top growth market movers and shakers were: St. Louis, Indianapolis, Denver, New Orleans, and San Jose – Santa Cruz.

Market Average Group Size Average Sq Ft Used
St. Louis, MO 96 1,876
Indianapolis, IN 94 1,976
Denver, CO 102 3,267
New Orleans, LA 95 2,027
San Jose – Santa Cruz, CA 88 2,650

These numbers and markets change weekly based on market dynamics and social trends.

Knowland tracks the weekly event activity across 166 U.S. markets with more globally and is expanding coverage regularly.

Talk to a Knowland data expert today for sneak peek at your market trends.

Category iconHot Data Trends Tag iconMeetings and Events Stats,  Weekly Group Business Trends

Primary Sidebar

Footer

  • Solutions
    • Hotel Properties
    • Above Property Management
    •   – Portfolio Capture
    •   – Market Analytics
    • CVBs and DMOs
    • Features & Pricing
    • Try for Free >
    • Demo Request >
  • Resources
    • Meetings Recovery Forecast
    • Hospitality Group & Business Performance Index
    • Success Stories
    • White Papers & Datasheets
    • Webcasts & Events
    • Blog
    • Sales Calculator
    • Glossary
  • Customers
    • Customer Sign In >
    • Support & Training
    • Billing Inquiries >
  • About Us
    • Meet Knowland
    • Culture
    • Job Openings
    • Press & Media
    • Sustainability
    • Contact Us >

LinkedIn Profile Twitter Profile Facebook Profile

info@knowland.com

clientcare@knowland.com

202-312-5880

2300 Wilson Blvd. Ste 700 Arlington, VA 22201

Subscribe for news and updates

© 2004–2023 Knowland Group

Privacy Policy

Cookie Settings