• Skip to primary navigation
  • Skip to main content
  • Skip to primary sidebar
  • Skip to footer
Knowland

Knowland

  • Solutions
    • Hotel Properties
      • Knowland Classic
      • Knowland Select
    • Above Property Management
      • Portfolio Capture
      • Market Analytics
    • CVBs and DMOs
    • Features & Pricing
  • Resources
    • Hospitality Group & Business Performance Index
    • Success Stories
    • White Papers & Datasheets
    • Webcasts & Events
    • Blog
    • Sales Calculator
    • Glossary
  • Customers
    • Customer Sign In >
    • Support & Training
    • Billing Inquiries >
  • About Us
    • Meet Knowland
    • Culture
    • Job Openings
    • Press & Media
    • Sustainability
    • Contact Us
  • Support
  • Sign In
  • Try for Free
  • Request a Demo
  • Support
  • Sign In >
TRY FOR FREE REQUEST DEMO

Weekly Group Meetings and Events Stats, Week Ending July 15, 2023

July 17, 2023

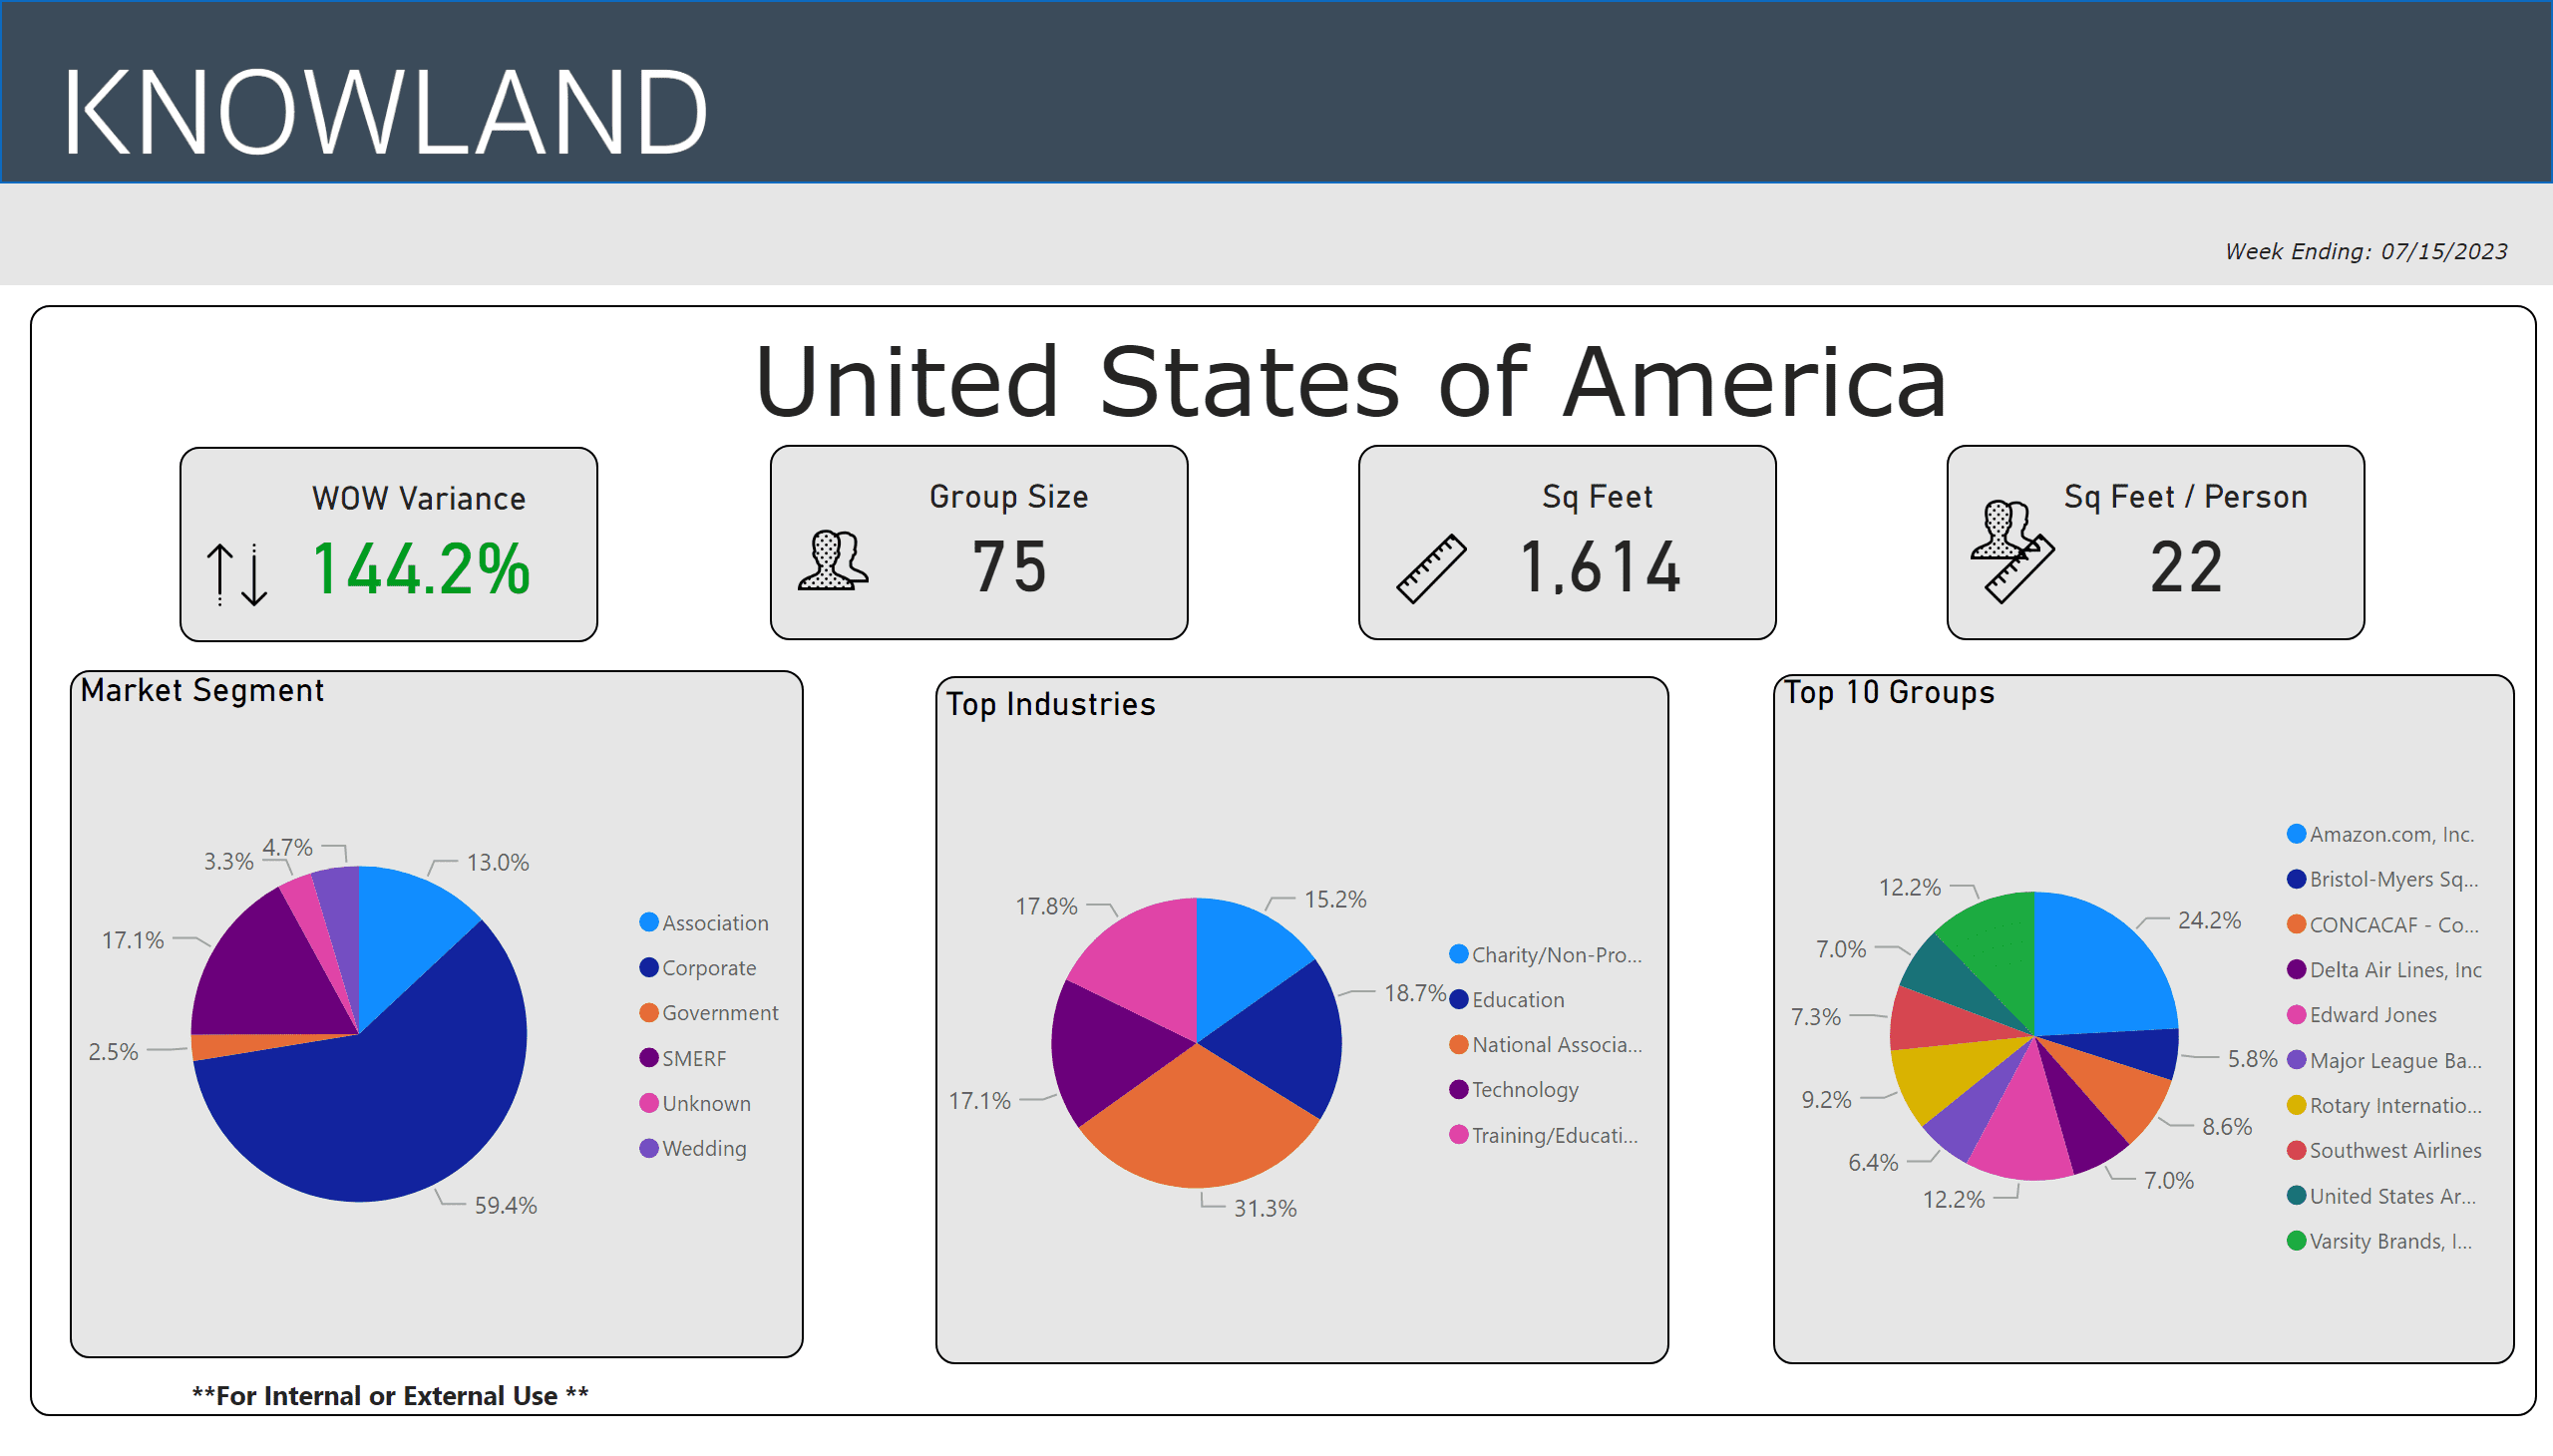
Events make big recovery after the summer holiday

For the week ending July 15, 2023, the number of U.S. meetings and events increased 144.2% compared to the prior week. This growth level is consistent coming off the previous down week due to the July 4th holiday. Corporate events took back its dominating over 50% share volume with 59.4% of meetings and events, with National Associations driving the dominant industry share at 31.3% for the week, followed by the Education segment at 18.7%.

Ready to see what is happening in your market today? Schedule a free market analysis to find out.

The average number of attendees for the week was 75 (compared to 84 last week), while the average square footage used was 1,614 (compared to 1,680) per event, and square feet used per person returned to 22.

Hot group trends 07-15-23

The top five segments for the week were: National Association, Education, Training/Education, Technology, and Charity/Non-Profit/Social Services.

The top growth market movers and shakers were: Chicago, Washington DC, Atlanta, Boston, and Los Angeles.

Market Average Group Size Average Sq Ft Used
Chicago, IL 75 1,974
Washington DC-MD-VA 83 2,055
Atlanta, GA 79 1,620
Boston, MA 56 1,372
Los Angeles – Long-Bech, CA 68 1,472

These numbers and markets change weekly based on market dynamics and social trends.

Knowland tracks the weekly event activity across 166 U.S. markets with more globally and is expanding coverage regularly.

Talk to a Knowland data expert today for sneak peek at your market trends.

Category iconHot Data Trends Tag iconMeetings and Events Stats,  Weekly Group Business Trends

Primary Sidebar

Footer

  • Solutions
    • Hotel Properties
    •   – Knowland Classic
    •   – Knowland Select
    • Above Property Management
    •   – Portfolio Capture
    •   – Market Analytics
    • CVBs and DMOs
    • Features & Pricing
    • Try for Free >
    • Demo Request >
  • Resources
    • Hospitality Group & Business Performance Index
    • Success Stories
    • White Papers & Datasheets
    • Webcasts & Events
    • Blog
    • Sales Calculator
    • Glossary
  • Customers
    • Customer Sign In >
    • Support & Training
    • Billing Inquiries >
  • About Us
    • Meet Knowland
    • Culture
    • Job Openings
    • Press & Media
    • Sustainability
    • Contact Us >

[email protected]

[email protected]

202-312-5880

2300 Wilson Blvd. Ste 700 Arlington, VA 22201

Subscribe for news and updates

© 2004–2025 Knowland Group

Privacy Policy

Cookie Settings