• Skip to primary navigation
  • Skip to main content
  • Skip to primary sidebar
  • Skip to footer
Knowland

Knowland

  • Solutions
    • Hotel Properties
      • Knowland Classic
      • Knowland Select
    • Above Property Management
      • Portfolio Capture
      • Market Analytics
    • CVBs and DMOs
    • Features & Pricing
  • Resources
    • Hospitality Group & Business Performance Index
    • Success Stories
    • White Papers & Datasheets
    • Webcasts & Events
    • Blog
    • Sales Calculator
    • Glossary
  • Customers
    • Customer Sign In >
    • Support & Training
    • Billing Inquiries >
  • About Us
    • Meet Knowland
    • Culture
    • Job Openings
    • Press & Media
    • Sustainability
    • Contact Us
  • Support
  • Sign In
  • Try for Free
  • Request a Demo
  • Support
  • Sign In >
TRY FOR FREE REQUEST DEMO

Weekly Group Meetings and Events Stats, Week Ending July 22, 2023

July 28, 2023

San Antonio makes it to the top 5 movers for the last week

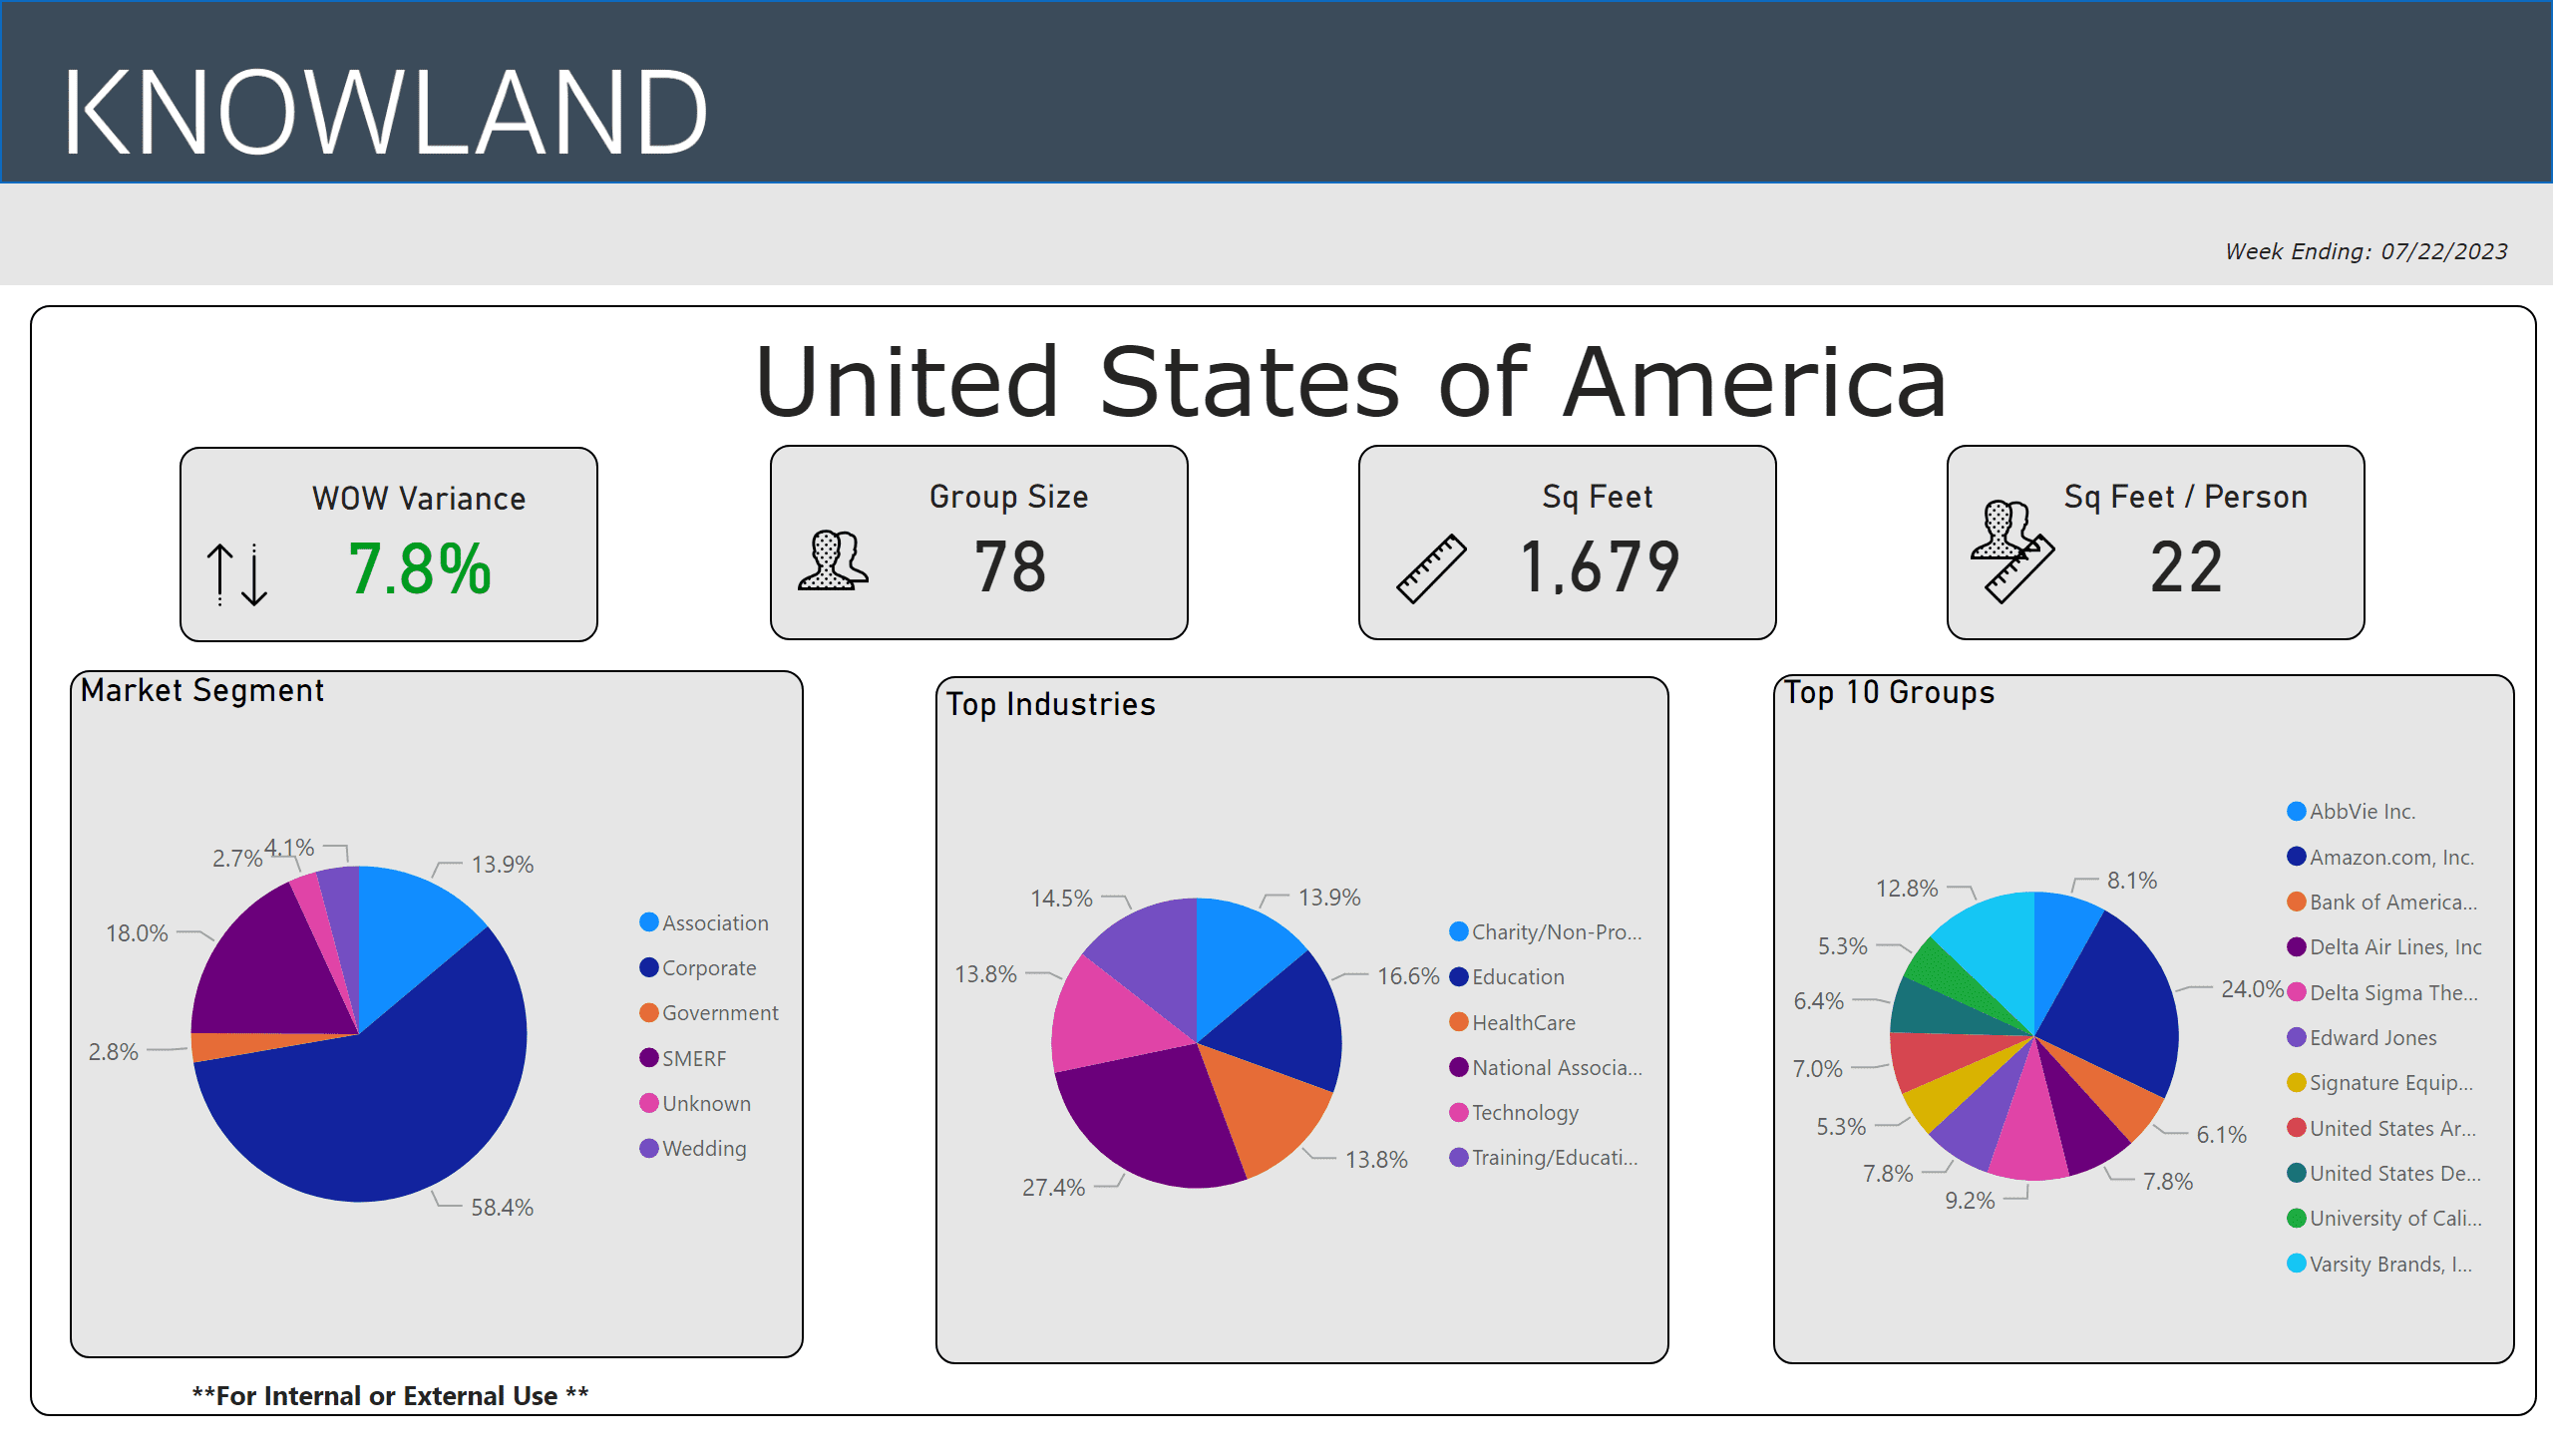
For the week ending July 22, 2023, the number of U.S. meetings and events increased 7.8% compared to the prior week. This growth level is consistent season trends for summer. Corporate events continue to dominate share volume with 58.4% of meetings and events, with National Associations driving the dominant industry share at 30.7% for the week, followed by the Religious segment at 21.9%.

Ready to see what is happening in your market today? Schedule a free market analysis to find out.

The average number of attendees for the week was 78 (compared to 75 last week), while the average square footage used was 1,679 (compared to 1,614) per event, and square feet used per person held at 22.

Meets and Events trends week ending 7-22-23

The top five segments for the week were: National Association, Education, Training/Education, Charity/Non-Profit/Social Services and Healthcare.

The top growth market movers and shakers were: Chicago, San Antonio, Denver, Charlotte, and Orlando.

Market Average Group Size Average Sq Ft Used
Chicago, IL 69 1,426
San Antonio, TX 87 2,172
Denver, CO 74 1,400
Charlotte, NC-SC 65 1,203
Orlando, FL 130 3,036

These numbers and markets change weekly based on market dynamics and social trends.

Knowland tracks the weekly event activity across 166 U.S. markets with more globally and is expanding coverage regularly.

Talk to a Knowland data expert today for sneak peek at your market trends.

Category iconHot Data Trends Tag iconMeetings and Events Stats,  Weekly Group Business Trends

Primary Sidebar

Footer

  • Solutions
    • Hotel Properties
    •   – Knowland Classic
    •   – Knowland Select
    • Above Property Management
    •   – Portfolio Capture
    •   – Market Analytics
    • CVBs and DMOs
    • Features & Pricing
    • Try for Free >
    • Demo Request >
  • Resources
    • Hospitality Group & Business Performance Index
    • Success Stories
    • White Papers & Datasheets
    • Webcasts & Events
    • Blog
    • Sales Calculator
    • Glossary
  • Customers
    • Customer Sign In >
    • Support & Training
    • Billing Inquiries >
  • About Us
    • Meet Knowland
    • Culture
    • Job Openings
    • Press & Media
    • Sustainability
    • Contact Us >

[email protected]

[email protected]

202-312-5880

2300 Wilson Blvd. Ste 700 Arlington, VA 22201

Subscribe for news and updates

© 2004–2025 Knowland Group

Privacy Policy

Cookie Settings