• Skip to primary navigation
  • Skip to main content
  • Skip to primary sidebar
  • Skip to footer
Knowland

Knowland

  • Solutions
    • Hotel Properties
      • Knowland Classic
      • Knowland Select
    • Above Property Management
      • Portfolio Capture
      • Market Analytics
    • CVBs and DMOs
    • Features & Pricing
  • Resources
    • Hospitality Group & Business Performance Index
    • Success Stories
    • White Papers & Datasheets
    • Webcasts & Events
    • Blog
    • Sales Calculator
    • Glossary
  • Customers
    • Customer Sign In >
    • Support & Training
    • Billing Inquiries >
  • About Us
    • Meet Knowland
    • Culture
    • Job Openings
    • Press & Media
    • Sustainability
    • Contact Us
  • Support
  • Sign In
  • Try for Free
  • Request a Demo
  • Support
  • Sign In >
TRY FOR FREE REQUEST DEMO

Weekly Group Meetings and Events Stats, Week Ending August 26, 2023

August 30, 2023

Atlanta shows the greatest weekly growth for meetings and events

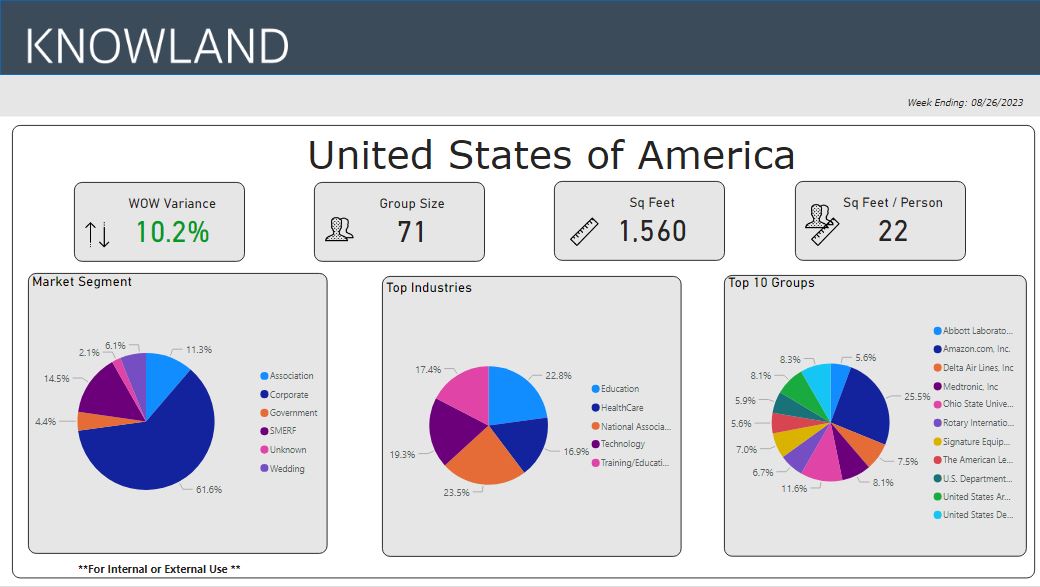
For the week ending August 26, 2023, the number of U.S. meetings and events increased 10.2% compared to the prior week. Corporate events captured the highest share volume with 61.6% of meetings and events, with National Associations driving the dominant industry share at 23.5% for the week, followed by the Education segment at 22.8%, for the top five segments.

Ready to see what is happening in your market today? Schedule a free market analysis to find out.

The average number of attendees for the week was 71 (compared to 70 last week), while the average square footage used was 1,560 (compared to 1,500) per event, and square feet used per person was 22.

Trends for 8-26-23

The top growth market movers and shakers were: Atlanta, Columbus, Orlando, Philadelphia, and Washington DC.

Market Average Group Size Average Sq Ft Used
Atlanta, GA 73 1,890
Columbus, OH 67 1,368
Orlando, FL 71 1,760
Philadelphia, PA 60 1,362
Washington DC-MD-VA 77 1,550

These numbers and markets change weekly based on market dynamics and social trends.

Knowland tracks the weekly event activity across 166 U.S. markets with more globally and is expanding coverage regularly.

Talk to a Knowland data expert today for sneak peek at your market trends.

Category iconHot Data Trends Tag iconMeetings and Events Stats,  Weekly Group Business Trends

Primary Sidebar

Footer

  • Solutions
    • Hotel Properties
    •   – Knowland Classic
    •   – Knowland Select
    • Above Property Management
    •   – Portfolio Capture
    •   – Market Analytics
    • CVBs and DMOs
    • Features & Pricing
    • Try for Free >
    • Demo Request >
  • Resources
    • Hospitality Group & Business Performance Index
    • Success Stories
    • White Papers & Datasheets
    • Webcasts & Events
    • Blog
    • Sales Calculator
    • Glossary
  • Customers
    • Customer Sign In >
    • Support & Training
    • Billing Inquiries >
  • About Us
    • Meet Knowland
    • Culture
    • Job Openings
    • Press & Media
    • Sustainability
    • Contact Us >

[email protected]

[email protected]

202-312-5880

2300 Wilson Blvd. Ste 700 Arlington, VA 22201

Subscribe for news and updates

© 2004–2025 Knowland Group

Privacy Policy

Cookie Settings