• Skip to primary navigation
  • Skip to main content
  • Skip to primary sidebar
  • Skip to footer
Knowland

Knowland

  • Solutions
    • Hotel Properties
    • Above Property Management
      • Portfolio Capture
      • Market Analytics
    • CVBs and DMOs
    • Features & Pricing
  • Resources
    • Meetings Recovery Forecast
    • Hospitality Group & Business Performance Index
    • Success Stories
    • White Papers & Datasheets
    • Webcasts & Events
    • Blog
    • Sales Calculator
    • Glossary
  • Customers
    • Customer Sign In >
    • Support & Training
    • Billing Inquiries >
  • About Us
    • Meet Knowland
    • Culture
    • Job Openings
    • Press & Media
    • Sustainability
    • Contact Us
  • Support
  • Sign In
  • Try for Free
  • Request a Demo
  • Support
  • Sign In >
TRY FOR FREE REQUEST DEMO

Weekly Group Meetings and Events Stats, Week Ending September 2, 2023

September 6, 2023

Back to school causes a dip, San Francisco has highest week-over-week growth

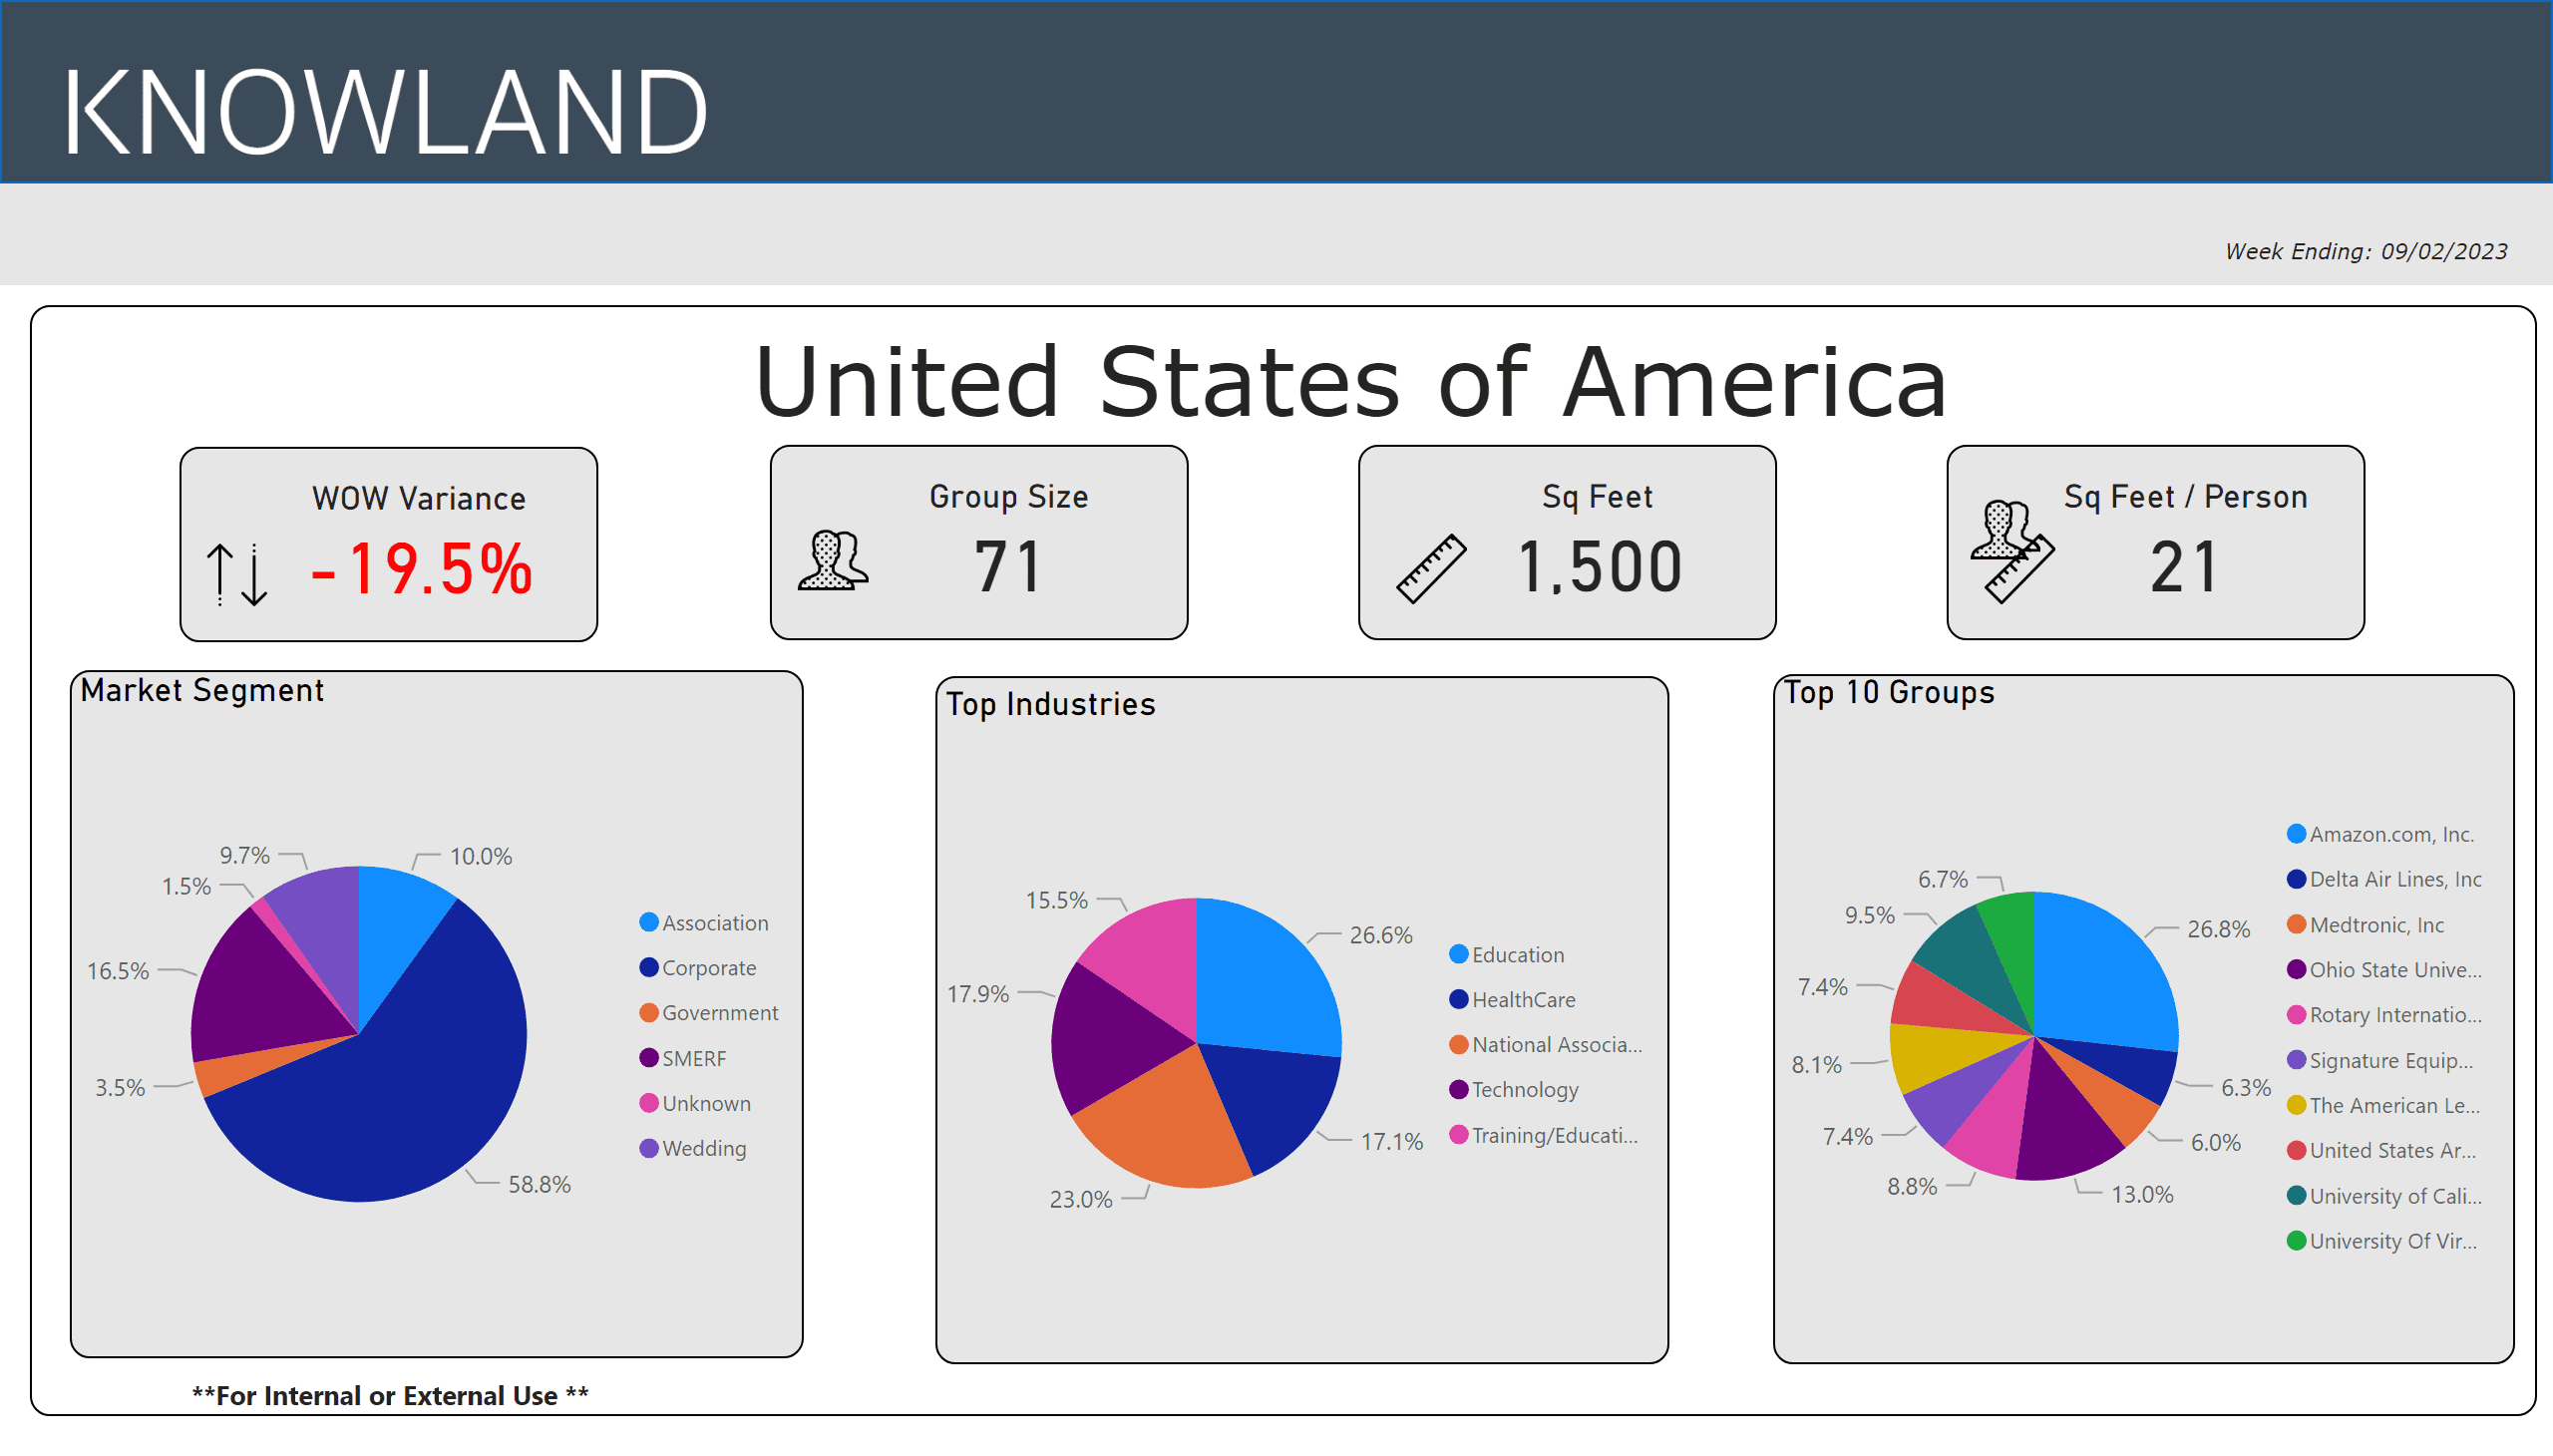
For the week ending September 2, 2023, the number of U.S. meetings and events decreased 19.5% compared to the prior week. The industry slowed as many families headed back to school and people started to celebrate the Labor Day holiday early. Corporate events continue to dominate share volume with 58.8% of meetings and events, with Education driving the dominant industry share at 26.6% for the week, followed by the National Association segment at 23.0%, for the top five segments.

Ready to see what is happening in your market today? Schedule a free market analysis to find out.

The average number of attendees for the week was 71 (compared to 76 last week), while the average square footage used was 1,500 (compared to 1,636) per event, and square feet used per person held at 21.

The top five segments for the week were: Education, National Association, Technology, Healthcare and Training/Education.

San Francisco took the top growth spot with an increase of 32% week over week. The top growth market movers and shakers were: San Francisco, Cleveland, Anaheim, St. Louis, and Washington State.

Market Average Group Size Average Sq Ft Used
San Francisco, CA 48 865
Cleveland, OH 38 800
Anaheim-Santa Ana, CA 68 1,235
St. Louis, MO 93 2,005
Washington State 61 989

These numbers and markets change weekly based on market dynamics and social trends.

Knowland tracks the weekly event activity across 166 U.S. markets with more globally and is expanding coverage regularly.

Talk to a Knowland data expert today for sneak peek at your market trends.

Category iconHot Data Trends Tag iconMeetings and Events Stats,  Weekly Group Business Trends

Primary Sidebar

Footer

  • Solutions
    • Hotel Properties
    • Above Property Management
    •   – Portfolio Capture
    •   – Market Analytics
    • CVBs and DMOs
    • Features & Pricing
    • Try for Free >
    • Demo Request >
  • Resources
    • Meetings Recovery Forecast
    • Hospitality Group & Business Performance Index
    • Success Stories
    • White Papers & Datasheets
    • Webcasts & Events
    • Blog
    • Sales Calculator
    • Glossary
  • Customers
    • Customer Sign In >
    • Support & Training
    • Billing Inquiries >
  • About Us
    • Meet Knowland
    • Culture
    • Job Openings
    • Press & Media
    • Sustainability
    • Contact Us >

LinkedIn Profile Twitter Profile Facebook Profile

info@knowland.com

clientcare@knowland.com

202-312-5880

2300 Wilson Blvd. Ste 700 Arlington, VA 22201

Subscribe for news and updates

© 2004–2023 Knowland Group

Privacy Policy

Cookie Settings