• Skip to primary navigation
  • Skip to main content
  • Skip to primary sidebar
  • Skip to footer
Knowland

Knowland

  • Solutions
    • Hotel Properties
      • Knowland Classic
      • Knowland Select
    • Above Property Management
      • Portfolio Capture
      • Market Analytics
    • CVBs and DMOs
    • Features & Pricing
  • Resources
    • Hospitality Group & Business Performance Index
    • Success Stories
    • White Papers & Datasheets
    • Webcasts & Events
    • Blog
    • Sales Calculator
    • Glossary
  • Customers
    • Customer Sign In >
    • Support & Training
    • Billing Inquiries >
  • About Us
    • Meet Knowland
    • Culture
    • Job Openings
    • Press & Media
    • Sustainability
    • Contact Us
  • Support
  • Sign In
  • Try for Free
  • Request a Demo
  • Support
  • Sign In >
TRY FOR FREE REQUEST DEMO

Weekly Group Meetings and Events Stats, Week Ending September 30, 2023

October 3, 2023

Salt Lake City makes the top 5 growth markets for the week

For the week ending September 30, 2023, the number of U.S. meetings and events increased 2.0% compared to the prior week. Los Angeles-Long Beach leads in growth with Austin ranking #2. Corporate events dominate share volume with up to 62.2% of meetings and events, with National Association driving the dominant industry share at 26.6% for the week, followed by the Education segment at 24.2%, for the top five segments.

The average number of attendees for the week was 80 (compared to 83 last week), while the average square footage used was up to 1,830 (compared to 1,980) per event, and square feet used per person was 23 (compared to 24).

Weekly Trends 9-30-23

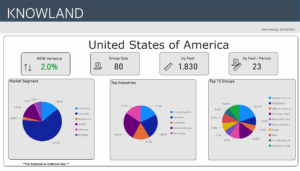
The top five segments for the week were: National Association, Education, Charity/Non-Profit/Social Services, Healthcare,  and Technology.

Los Angeles took the top growth spot week over week. The full list of top growth market movers and shakers were: Los Angeles-Long Beach, Austin, Phoenix, Salt Lake City-Ogden, and Philadelphia.

Market Average Group Size Average Sq Ft Used
Los Angeles-Long Beach 89 1,895
Austin, TX 72 1,617
Phoenix, TX 126 3,399
Salt Lake City, UT 52 1,333
Philadelphia, PA 57 1,485

These numbers and markets change weekly based on market dynamics and social trends.

Knowland tracks the weekly event activity across 166 U.S. markets with more globally and is expanding coverage regularly.

Talk to a Knowland data expert today for sneak peek at your market trends.

Category iconHot Data Trends Tag iconMeetings and Events Stats,  Salt L,  Weekly Group Business Trends

Primary Sidebar

Footer

  • Solutions
    • Hotel Properties
    •   – Knowland Classic
    •   – Knowland Select
    • Above Property Management
    •   – Portfolio Capture
    •   – Market Analytics
    • CVBs and DMOs
    • Features & Pricing
    • Try for Free >
    • Demo Request >
  • Resources
    • Hospitality Group & Business Performance Index
    • Success Stories
    • White Papers & Datasheets
    • Webcasts & Events
    • Blog
    • Sales Calculator
    • Glossary
  • Customers
    • Customer Sign In >
    • Support & Training
    • Billing Inquiries >
  • About Us
    • Meet Knowland
    • Culture
    • Job Openings
    • Press & Media
    • Sustainability
    • Contact Us >

[email protected]

[email protected]

202-312-5880

2300 Wilson Blvd. Ste 700 Arlington, VA 22201

Subscribe for news and updates

© 2004–2025 Knowland Group

Privacy Policy

Cookie Settings