• Skip to primary navigation
  • Skip to main content
  • Skip to primary sidebar
  • Skip to footer
Knowland

Knowland

  • Solutions
    • Hotel Properties
      • Knowland Classic
      • Knowland Select
    • Above Property Management
      • Portfolio Capture
      • Market Analytics
    • CVBs and DMOs
    • Features & Pricing
  • Resources
    • Hospitality Group & Business Performance Index
    • Success Stories
    • White Papers & Datasheets
    • Webcasts & Events
    • Blog
    • Sales Calculator
    • Glossary
  • Customers
    • Customer Sign In >
    • Support & Training
    • Billing Inquiries >
  • About Us
    • Meet Knowland
    • Culture
    • Job Openings
    • Press & Media
    • Sustainability
    • Contact Us
  • Support
  • Sign In
  • Try for Free
  • Request a Demo
  • Support
  • Sign In >
TRY FOR FREE REQUEST DEMO

Weekly Group Meetings and Events Stats, Week Ending November 11, 2023

November 15, 2023

Week over week growth of 20% from pre-holiday event burst; Phoenix leads in growth

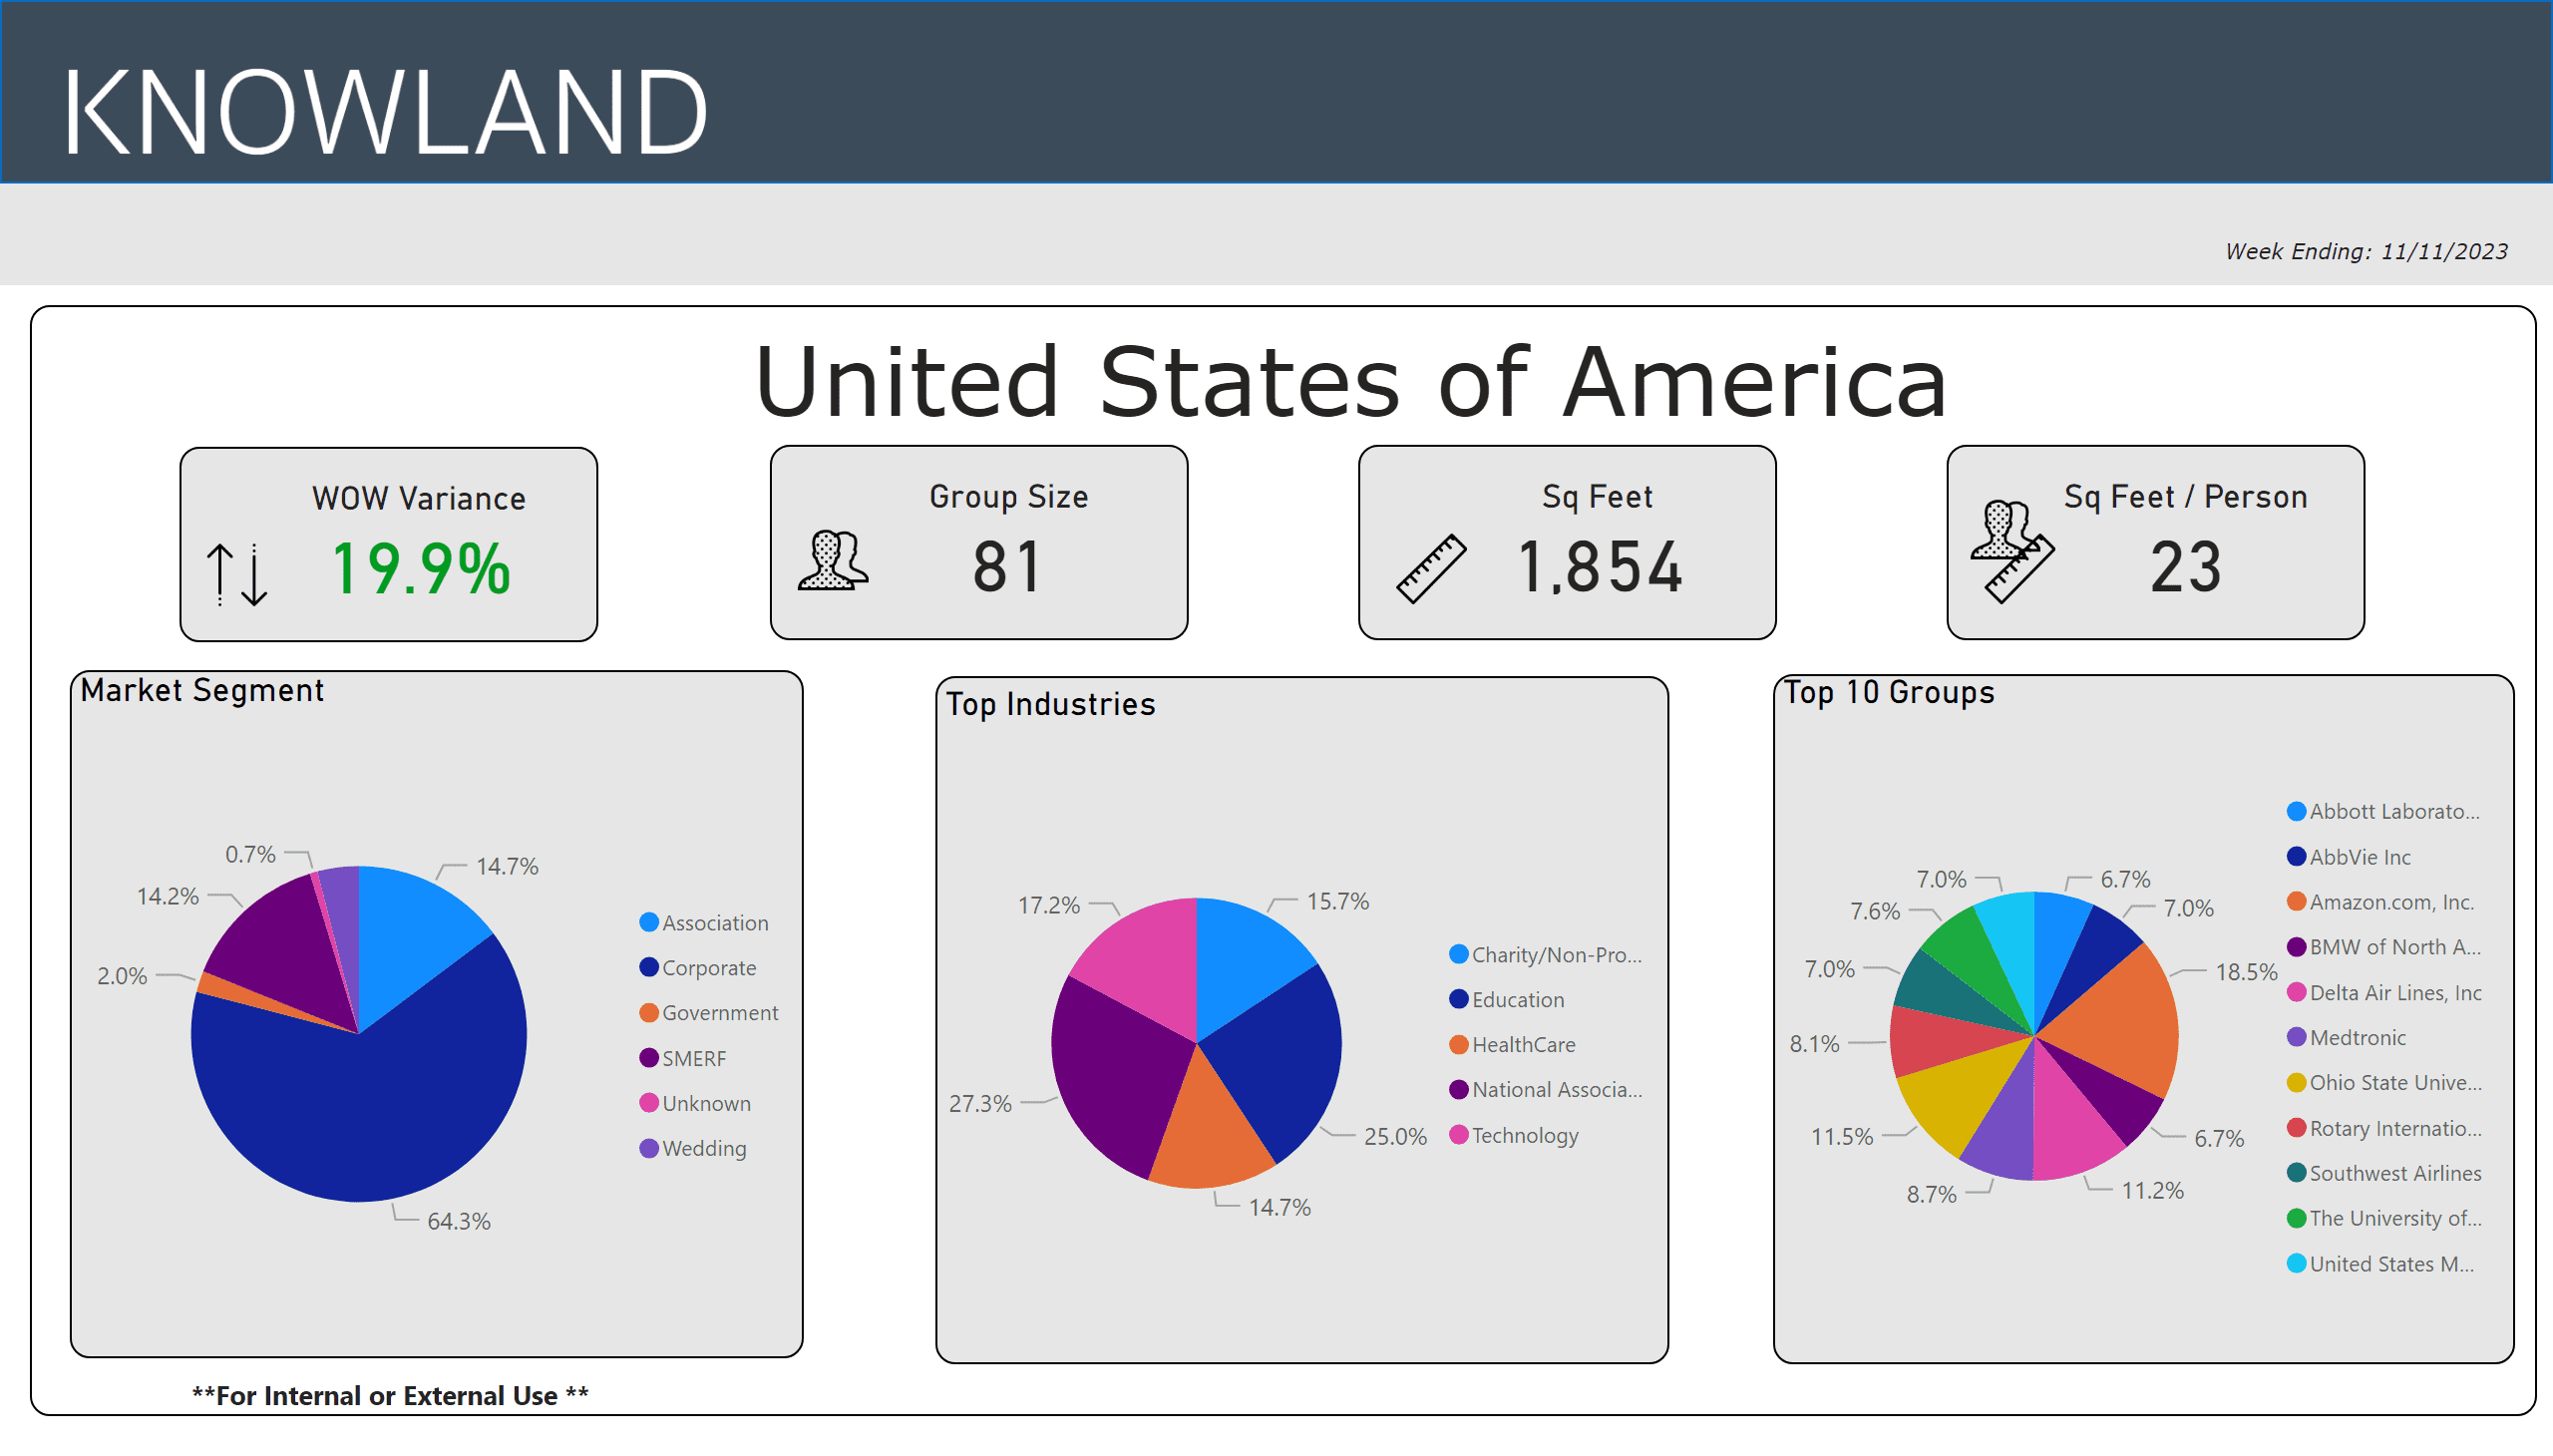
For the week ending November 11, 2023, the number of U.S. meetings and events increased 19.9% compared to the prior week, as the U.S. gets in last minute meetings and events prior to the holiday season to come.  Phoenix leads in week-over-week growth, group size and space used. Corporate events dominate share volume at a slightly lower share with 64.3% of meetings and events, with National Association driving the dominant industry share at 27.3% for the week, followed by the Education segment at 25.0%, for the top five segments.

The average number of attendees for the week was 81 ( compared to 83 for the previous week), while the average square footage used was 1,854 per event (compared to 1,836 for the previous week), and square feet used per person was 22.

Hot data Nov 11

The top five segments for the week were: National Association, Education, Technology, Charity/Non-Profit/Social Services, and Healthcare.

The full list of top growth market movers and shakers were:  Phoenix, Atlanta, Nashville, San Diego, and Dallas.

Market Average Group Size Average Sq Ft Used
Phoenix, AZ 91 2,414
Atlanta, GA 70 1,938
Nashville, TN 68 1,202
San Diego, CA 89 2,259
Dallas, TX 80 1,895

These numbers and markets change weekly based on market dynamics and social trends.

Knowland tracks the weekly event activity across 166 U.S. markets with more globally and is expanding coverage regularly.

Talk to a Knowland data expert today for sneak peek at your market trends.

Category iconHot Data Trends Tag iconPhoenix Meeting Trends,  Weekly Group Business Trends

Primary Sidebar

Footer

  • Solutions
    • Hotel Properties
    •   – Knowland Classic
    •   – Knowland Select
    • Above Property Management
    •   – Portfolio Capture
    •   – Market Analytics
    • CVBs and DMOs
    • Features & Pricing
    • Try for Free >
    • Demo Request >
  • Resources
    • Hospitality Group & Business Performance Index
    • Success Stories
    • White Papers & Datasheets
    • Webcasts & Events
    • Blog
    • Sales Calculator
    • Glossary
  • Customers
    • Customer Sign In >
    • Support & Training
    • Billing Inquiries >
  • About Us
    • Meet Knowland
    • Culture
    • Job Openings
    • Press & Media
    • Sustainability
    • Contact Us >

[email protected]

[email protected]

202-312-5880

2300 Wilson Blvd. Ste 700 Arlington, VA 22201

Subscribe for news and updates

© 2004–2025 Knowland Group

Privacy Policy

Cookie Settings