• Skip to primary navigation
  • Skip to main content
  • Skip to primary sidebar
  • Skip to footer
Knowland

Knowland

  • Solutions
    • Hotel Properties
      • Knowland Classic
      • Knowland Select
    • Above Property Management
      • Portfolio Capture
      • Market Analytics
    • CVBs and DMOs
    • Features & Pricing
  • Resources
    • Hospitality Group & Business Performance Index
    • Success Stories
    • White Papers & Datasheets
    • Webcasts & Events
    • Blog
    • Sales Calculator
    • Glossary
  • Customers
    • Customer Sign In >
    • Support & Training
    • Billing Inquiries >
  • About Us
    • Meet Knowland
    • Culture
    • Job Openings
    • Press & Media
    • Sustainability
    • Contact Us
  • Support
  • Sign In
  • Try for Free
  • Request a Demo
  • Support
  • Sign In >
TRY FOR FREE REQUEST DEMO

Weekly Group Meetings and Events Stats, Week Ending November 4, 2023

November 8, 2023

Of top 5 market movers, Maui reports the highest average group size and space used

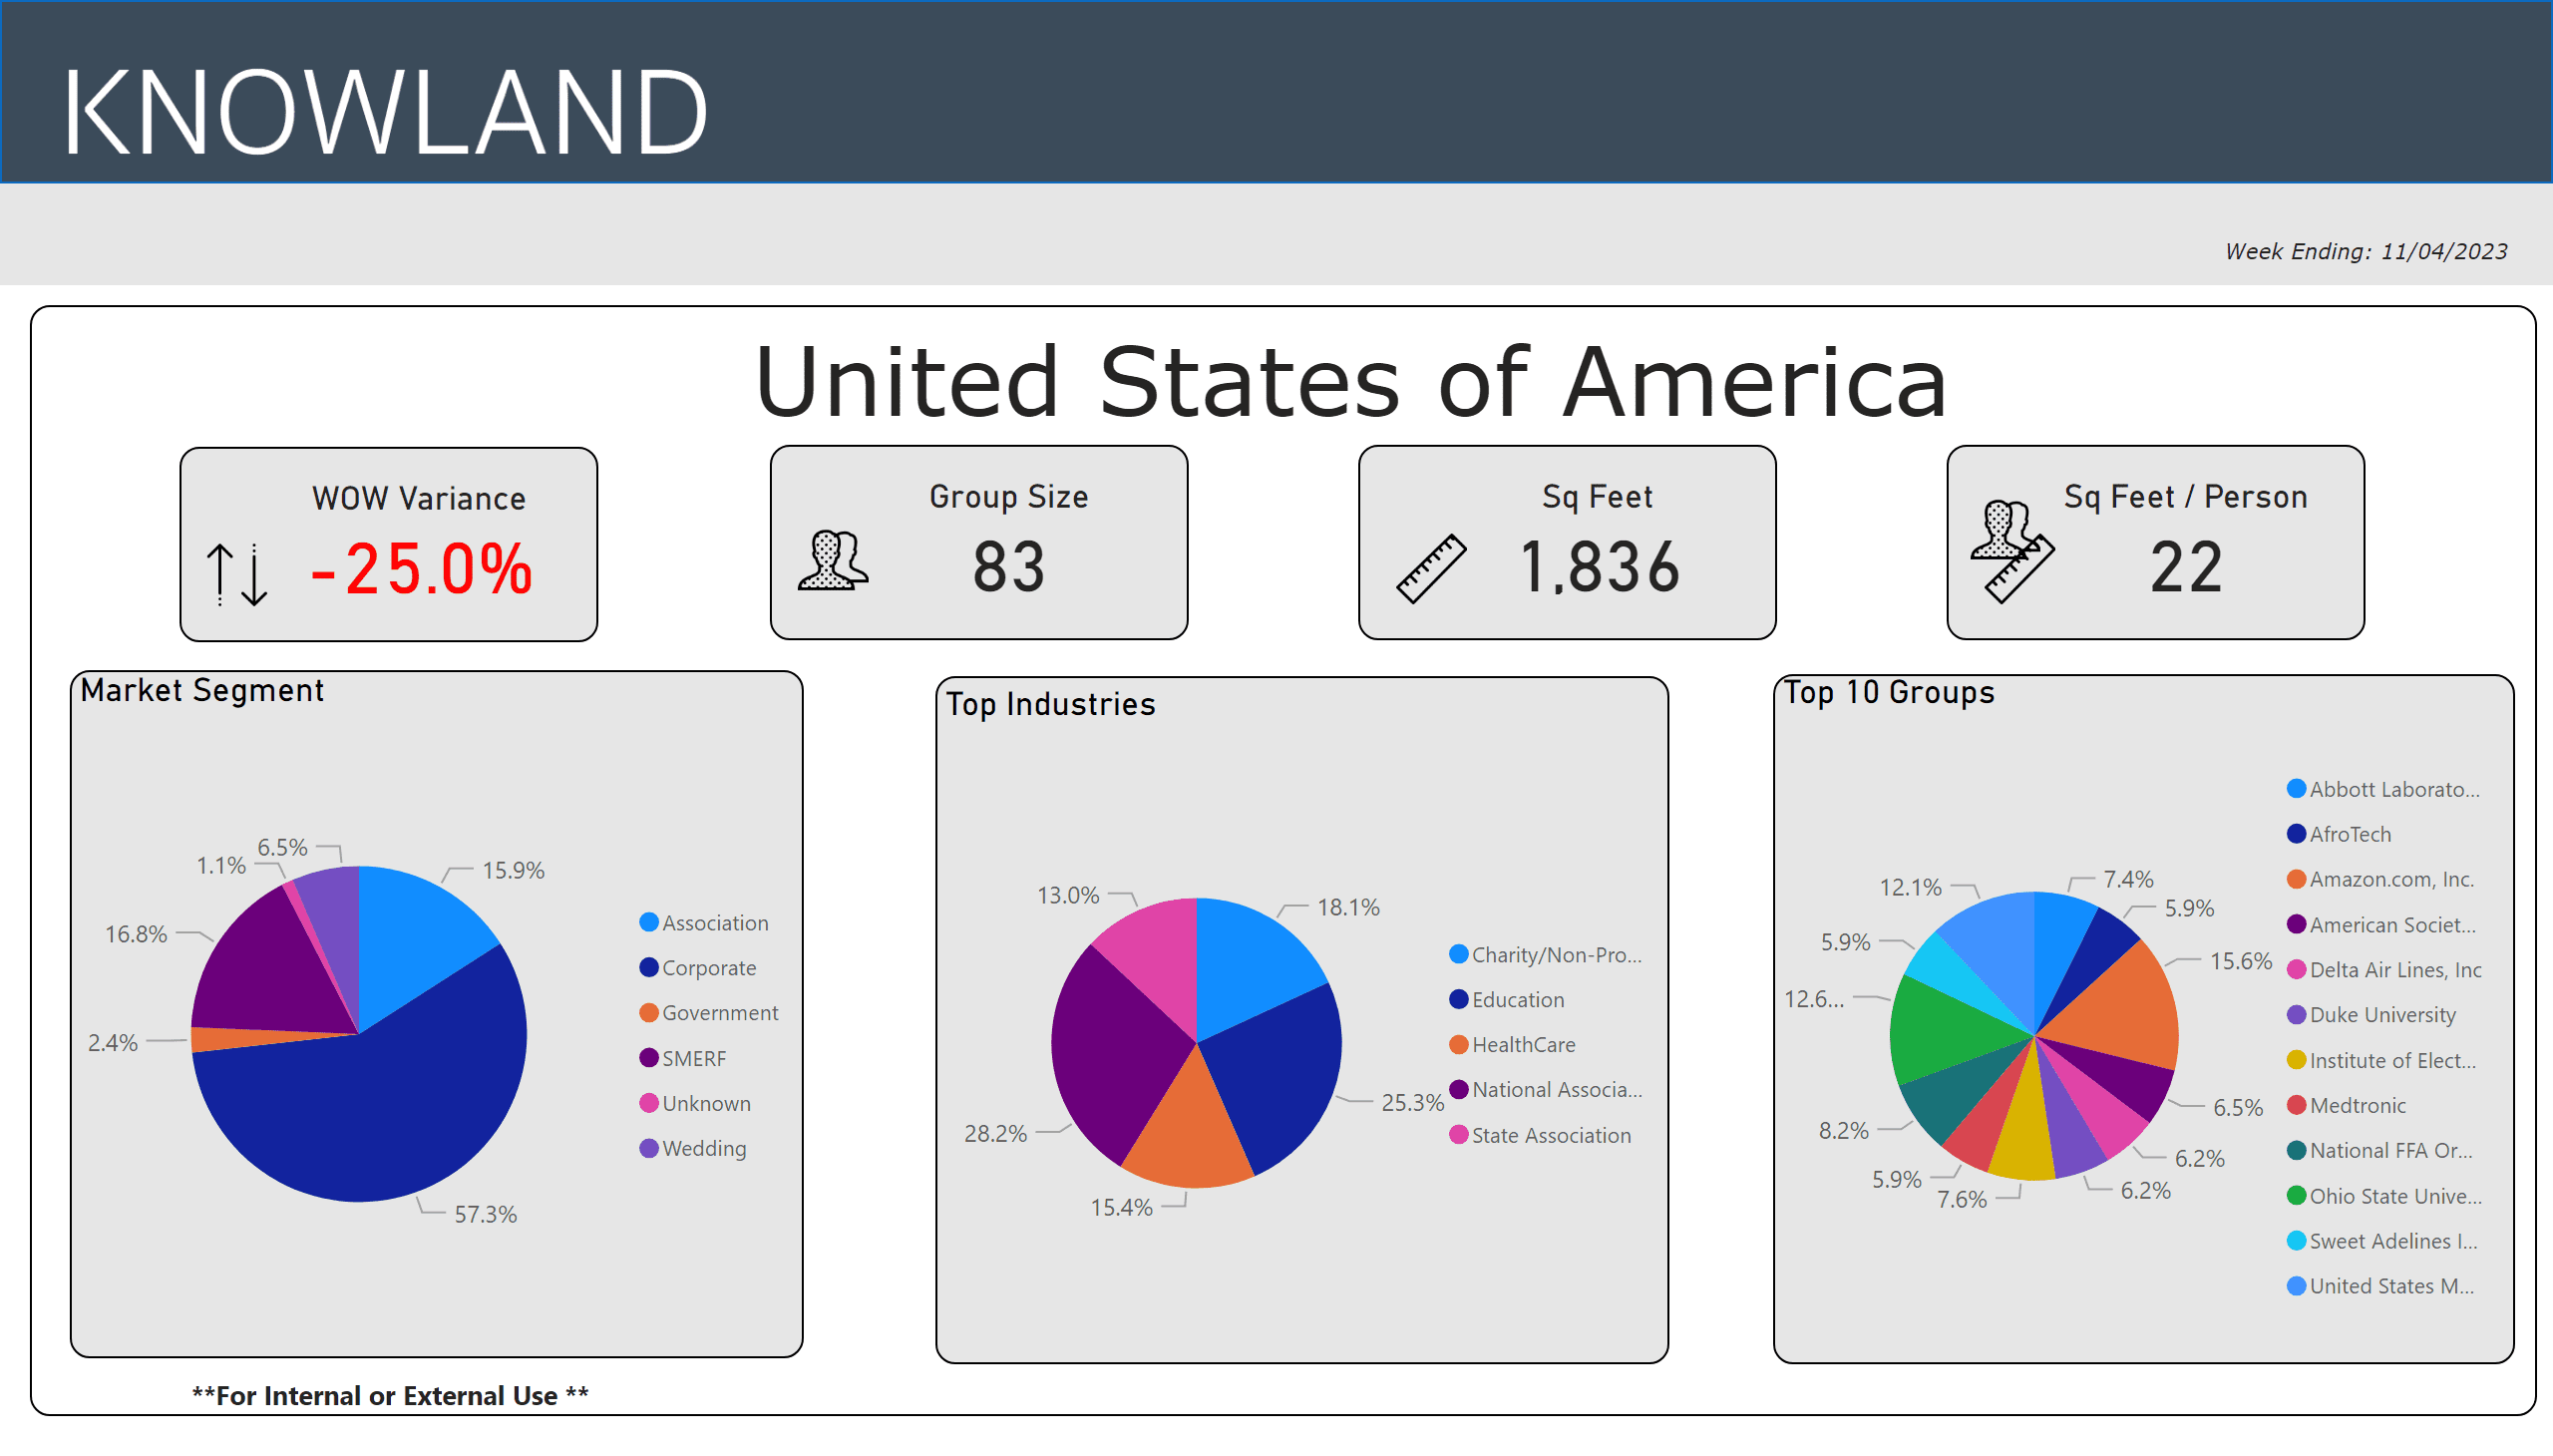
For the week ending November 4, 2023, the number of U.S. meetings and events decreased 25% compared to the prior week, as the U.S. celebrated Halloween during a period of fewer hosted events.  San Francisco leads in week-over-week growth . Corporate events dominate share volume at a slightly lower share with 57.3% of meetings and events, with National Association driving the dominant industry share at 28.2% for the week, followed by the Education segment at 25.3%, for the top five segments.

The average number of attendees for the week was 83 ( compared to 87 for the previous week), while the average square footage used was 1,836 per event (compared to 2,000 for the previous week), and square feet used per person was 22.

Trends for week ending Nov 4

The top five segments for the week were: National Association, Education, Charity/Non-Profit/Social Services, Healthcare and State Association.

The full list of top growth market movers and shakers were:  San Francisco, Florida Keys, Oklahoma City, Richmond, and Maui Island.

Market Average Group Size Average Sq Ft Used
San Francisco-San Mateo, CA 76 1,650
Florida Keys 61 1,454
Oklahoma City, OK 76 1,472
Richmond-Petersburg, VA 50 1,339
Maui Island, HI 206 5,288

These numbers and markets change weekly based on market dynamics and social trends.

Knowland tracks the weekly event activity across 166 U.S. markets with more globally and is expanding coverage regularly.

Talk to a Knowland data expert today for sneak peek at your market trends.

Category iconHot Data Trends Tag iconMaui Meeting and Event trends,  Weekly Group Business Trends

Primary Sidebar

Footer

  • Solutions
    • Hotel Properties
    •   – Knowland Classic
    •   – Knowland Select
    • Above Property Management
    •   – Portfolio Capture
    •   – Market Analytics
    • CVBs and DMOs
    • Features & Pricing
    • Try for Free >
    • Demo Request >
  • Resources
    • Hospitality Group & Business Performance Index
    • Success Stories
    • White Papers & Datasheets
    • Webcasts & Events
    • Blog
    • Sales Calculator
    • Glossary
  • Customers
    • Customer Sign In >
    • Support & Training
    • Billing Inquiries >
  • About Us
    • Meet Knowland
    • Culture
    • Job Openings
    • Press & Media
    • Sustainability
    • Contact Us >

[email protected]

[email protected]

202-312-5880

2300 Wilson Blvd. Ste 700 Arlington, VA 22201

Subscribe for news and updates

© 2004–2025 Knowland Group

Privacy Policy

Cookie Settings