• Skip to primary navigation
  • Skip to main content
  • Skip to primary sidebar
  • Skip to footer
Knowland

Knowland

  • Solutions
    • Hotel Properties
      • Knowland Classic
      • Knowland Select
    • Above Property Management
      • Portfolio Capture
      • Market Analytics
    • CVBs and DMOs
    • Features & Pricing
  • Resources
    • Hospitality Group & Business Performance Index
    • Success Stories
    • White Papers & Datasheets
    • Webcasts & Events
    • Blog
    • Sales Calculator
    • Glossary
  • Customers
    • Customer Sign In >
    • Support & Training
    • Billing Inquiries >
  • About Us
    • Meet Knowland
    • Culture
    • Job Openings
    • Press & Media
    • Sustainability
    • Contact Us
  • Support
  • Sign In
  • Try for Free
  • Request a Demo
  • Support
  • Sign In >
TRY FOR FREE REQUEST DEMO

Weekly Group Meetings and Events Stats, Week Ending April 27, 2024

April 29, 2024

Boston leads meeting growth

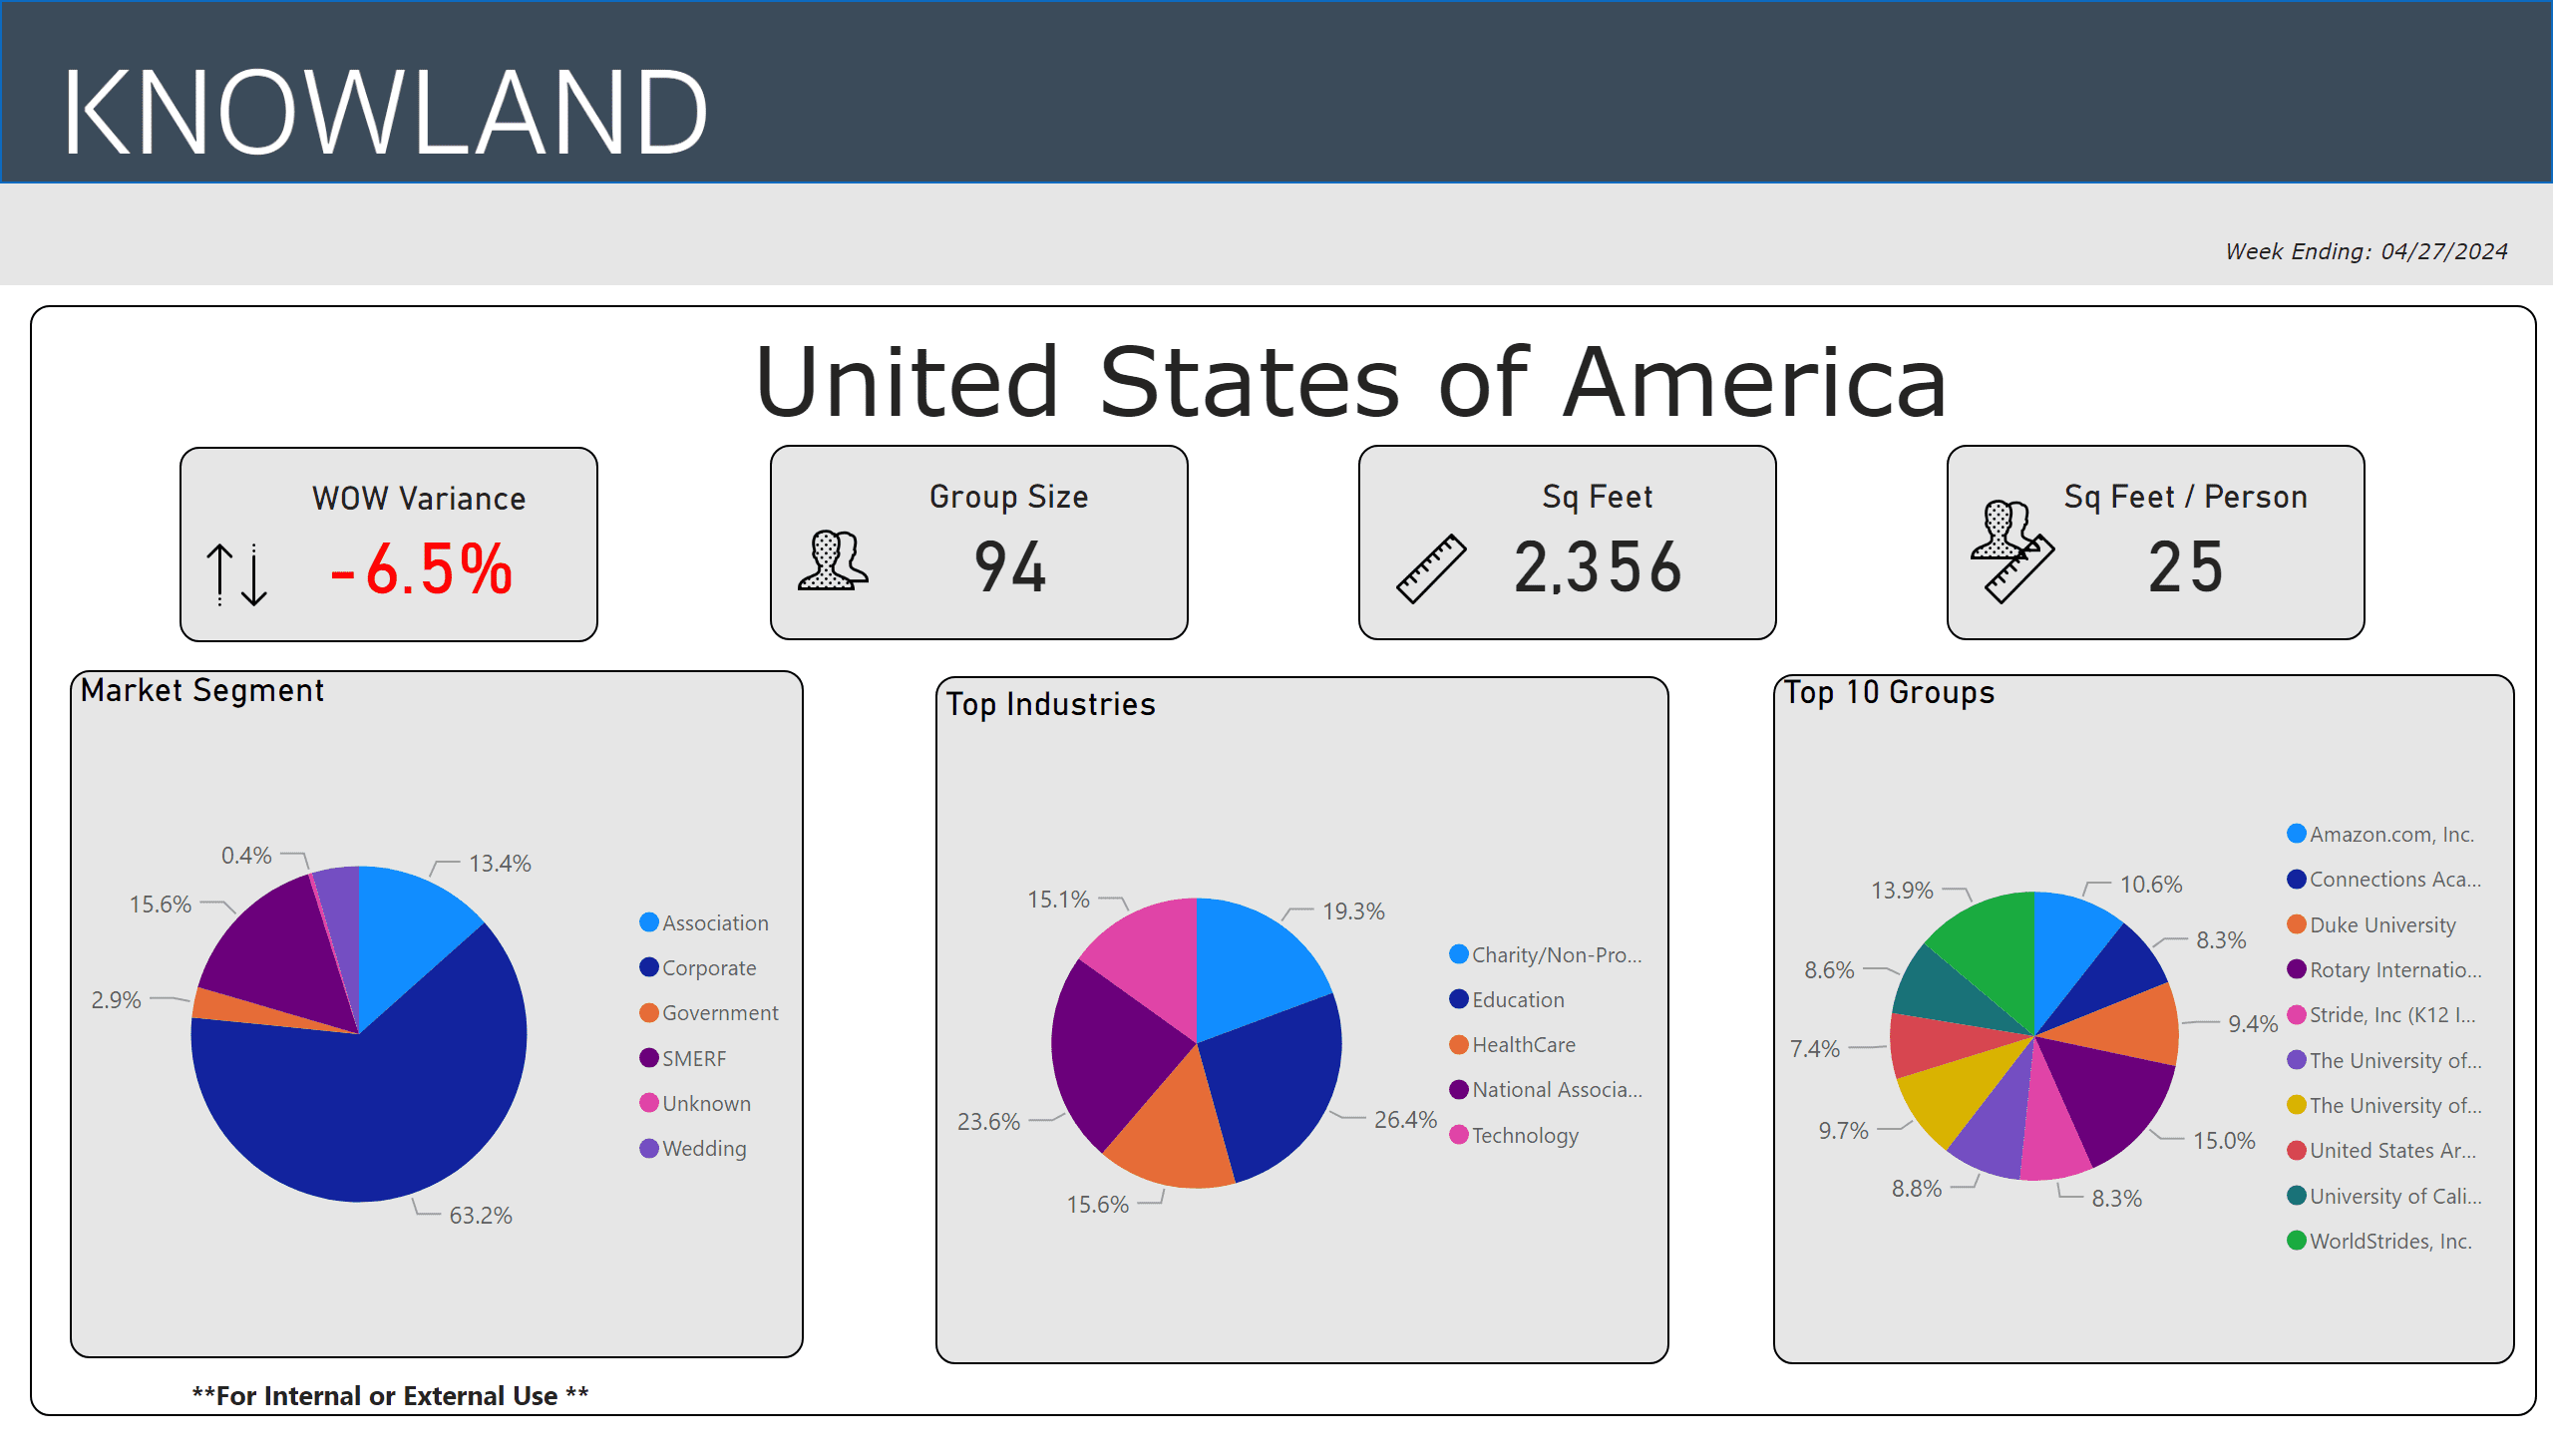
For the week ending April 27, 2024, the number of U.S. meetings and events fell 6.5% compared to the previous week. Corporate events share volume is 63.2%, with Education driving the dominant industry share at 28.3% for the week, followed by the National Association segment at 26.5%, for the top five segments. Boston showed the largest week over week growth of the top 5 “mover and shaker” markets.

The average number of attendees for the week was 94, while the average square footage used was 2,356 per event, and square feet used per person was 25.

This week's meeting trends 4-27-24

The top five segments for the week were: Education, National Association, Charity/Non-Profit/Social Services, Healthcare, and Technology.

The full list of top growth market movers and shakers were:  Boston, California North, Portland, Myrtle Beach, and Pittsburgh, with the largest week over week volume change.

Market Average Group Size Average Sq Ft Used
Boston, MA 86 2,150
California North 121 3,449
Portland, OR 140 3,539
Myrtle Beach, SC 211 5,209
Pittsburgh, PA 87 2,652

These numbers and markets change weekly based on market dynamics and social trends.

Knowland tracks the weekly event activity across 166 U.S. markets with more globally and is expanding coverage regularly.

Talk to a Knowland data expert today for sneak peek at your market trends5

Category iconHot Data Trends Tag icon2024 Meeting Trends,  Boston Meeting Trends,  Weekly Group Business Trends

Primary Sidebar

Footer

  • Solutions
    • Hotel Properties
    •   – Knowland Classic
    •   – Knowland Select
    • Above Property Management
    •   – Portfolio Capture
    •   – Market Analytics
    • CVBs and DMOs
    • Features & Pricing
    • Try for Free >
    • Demo Request >
  • Resources
    • Hospitality Group & Business Performance Index
    • Success Stories
    • White Papers & Datasheets
    • Webcasts & Events
    • Blog
    • Sales Calculator
    • Glossary
  • Customers
    • Customer Sign In >
    • Support & Training
    • Billing Inquiries >
  • About Us
    • Meet Knowland
    • Culture
    • Job Openings
    • Press & Media
    • Sustainability
    • Contact Us >

[email protected]

[email protected]

202-312-5880

2300 Wilson Blvd. Ste 700 Arlington, VA 22201

Subscribe for news and updates

© 2004–2025 Knowland Group

Privacy Policy

Cookie Settings