• Skip to primary navigation
  • Skip to main content
  • Skip to primary sidebar
  • Skip to footer
Knowland

Knowland

  • Solutions
    • Hotel Properties
      • Knowland Classic
      • Knowland Select
    • Above Property Management
      • Portfolio Capture
      • Market Analytics
    • CVBs and DMOs
    • Features & Pricing
  • Resources
    • Hospitality Group & Business Performance Index
    • Success Stories
    • White Papers & Datasheets
    • Webcasts & Events
    • Blog
    • Sales Calculator
    • Glossary
  • Customers
    • Customer Sign In >
    • Support & Training
    • Billing Inquiries >
  • About Us
    • Meet Knowland
    • Culture
    • Job Openings
    • Press & Media
    • Sustainability
    • Contact Us
  • Support
  • Sign In
  • Try for Free
  • Request a Demo
  • Support
  • Sign In >
TRY FOR FREE REQUEST DEMO

Weekly Group Meetings and Events Stats, Week Ending March 30, 2024

April 2, 2024

San Antonio is the top mover for the week

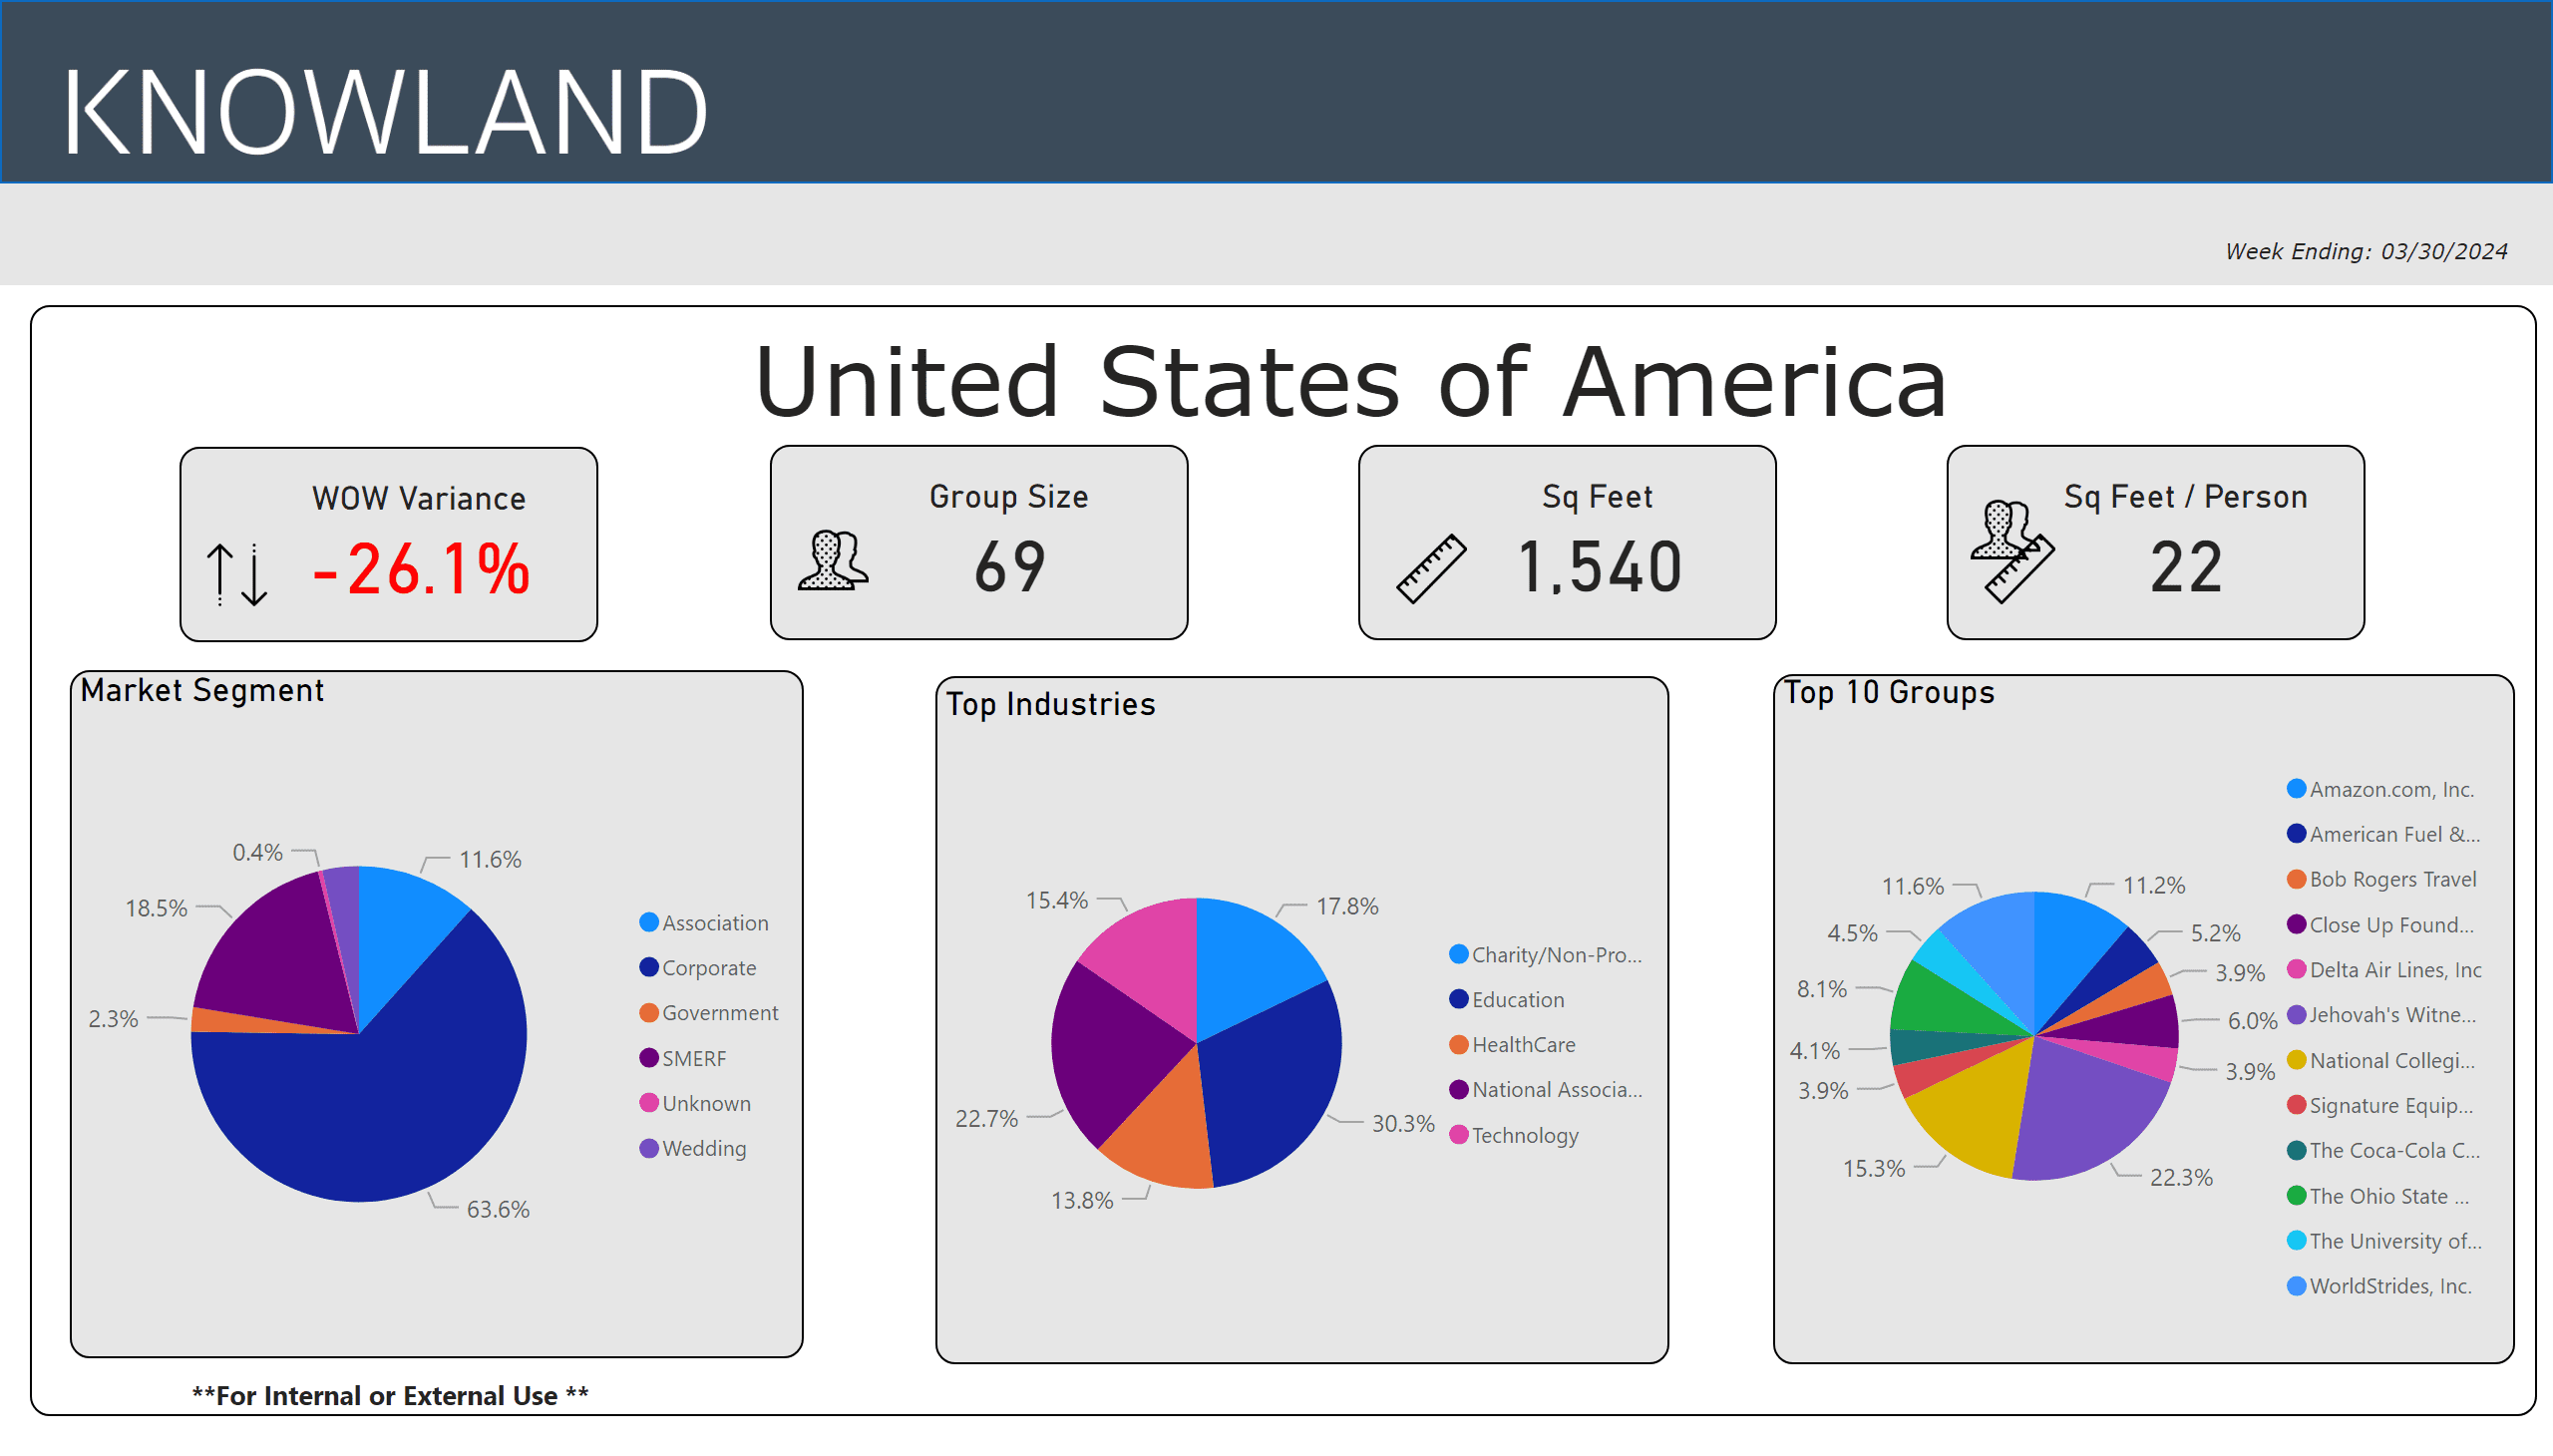
For the week ending March 30, 2024, the number of U.S. meetings and events decreased 26.1% compared to the previous week. An early Easter holiday – Easter typically falls in April — combined with student Spring breaks, resulted in low meeting and event volume for the week. Corporate events share volume is 63.6%, with Education driving the dominant industry share at 28.3% for the week, followed by the National Association segment at 25.4%, for the top five segments. San Antonio showed the largest week over week growth of the top 5 “mover and shaker” markets.

The average number of attendees for the week was 69, while the average square footage used was 1,540 per event, and square feet used per person was 22.

3-3-24 hot trends

The top five segments for the week were: Education, National Association, Charity/Non-Profit/Social Services, Technology, and Healthcare.

The full list of top growth market movers and shakers were:  San Antonio, Indianapolis, Tulsa, Newark and Alaska, with the largest week over week volume change.

Market Average Group Size Average Sq Ft Used
San Antonio, TX 40 924
Indianapolis, IN 59 1,075
Tulsa, OK 68 1,100
Newark, NJ 110 2,040
Alaska 157 3,569

These numbers and markets change weekly based on market dynamics and social trends.

Knowland tracks the weekly event activity across 166 U.S. markets with more globally and is expanding coverage regularly.

Talk to a Knowland data expert today for sneak peek at your market trends5

Category iconHot Data Trends Tag icon2024 Meeting Trends,  Easter and Spring Break influence,  San Antonio,  Weekly Group Business Trends

Primary Sidebar

Footer

  • Solutions
    • Hotel Properties
    •   – Knowland Classic
    •   – Knowland Select
    • Above Property Management
    •   – Portfolio Capture
    •   – Market Analytics
    • CVBs and DMOs
    • Features & Pricing
    • Try for Free >
    • Demo Request >
  • Resources
    • Hospitality Group & Business Performance Index
    • Success Stories
    • White Papers & Datasheets
    • Webcasts & Events
    • Blog
    • Sales Calculator
    • Glossary
  • Customers
    • Customer Sign In >
    • Support & Training
    • Billing Inquiries >
  • About Us
    • Meet Knowland
    • Culture
    • Job Openings
    • Press & Media
    • Sustainability
    • Contact Us >

[email protected]

[email protected]

202-312-5880

2300 Wilson Blvd. Ste 700 Arlington, VA 22201

Subscribe for news and updates

© 2004–2025 Knowland Group

Privacy Policy

Cookie Settings