• Skip to primary navigation
  • Skip to main content
  • Skip to primary sidebar
  • Skip to footer
Knowland

Knowland

  • Solutions
    • Hotel Properties
      • Knowland Classic
      • Knowland Select
    • Above Property Management
      • Portfolio Capture
      • Market Analytics
    • CVBs and DMOs
    • Features & Pricing
  • Resources
    • Hospitality Group & Business Performance Index
    • Success Stories
    • White Papers & Datasheets
    • Webcasts & Events
    • Blog
    • Sales Calculator
    • Glossary
  • Customers
    • Customer Sign In >
    • Support & Training
    • Billing Inquiries >
  • About Us
    • Meet Knowland
    • Culture
    • Job Openings
    • Press & Media
    • Sustainability
    • Contact Us
  • Support
  • Sign In
  • Try for Free
  • Request a Demo
  • Support
  • Sign In >
TRY FOR FREE REQUEST DEMO

Weekly Group Meetings and Events Stats, Week Ending June 22, 2024

June 28, 2024

Strong secondary market event activity in Tulsa and Long Island

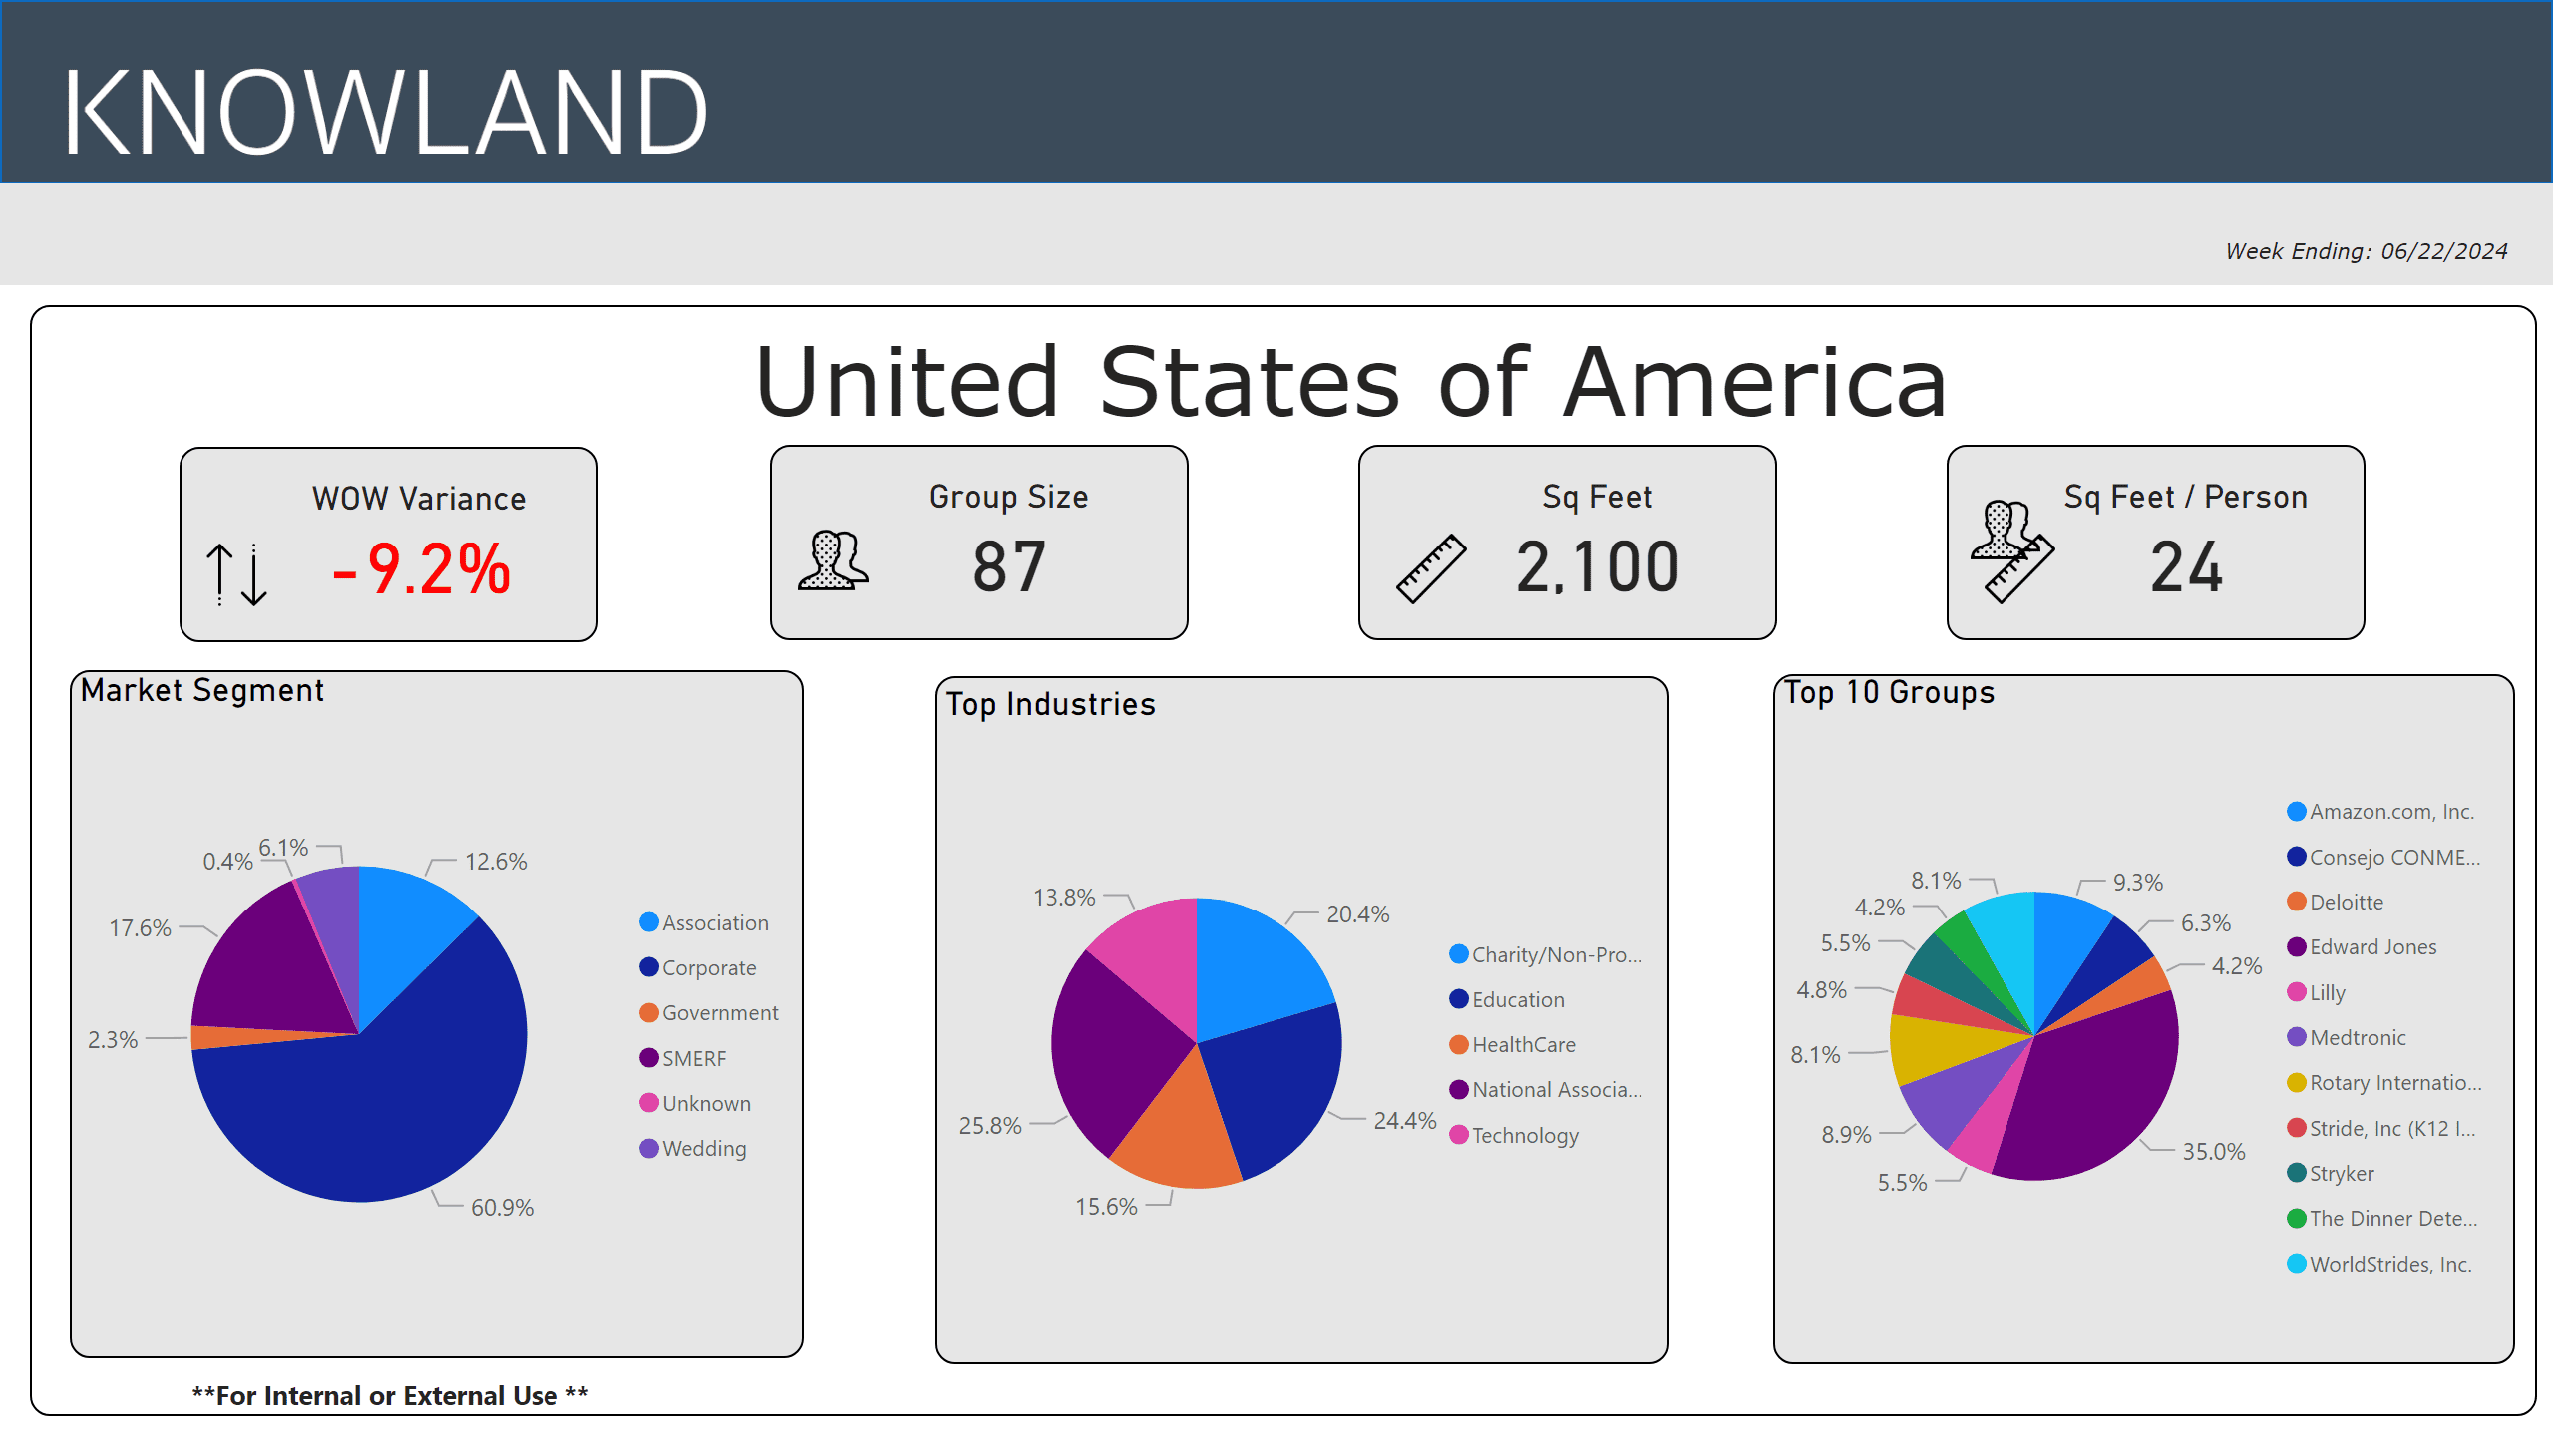
For the week ending June 22, 2024, the growth of U.S. meetings and events was down 9.2% compared to the previous week. Corporate events share volume is 60.9%, with National Association and Education segments leading growth with 25.8% and 24.4% share respectively, for the top five segments. At 33%, Anaheim-Santa Ana, CA  showed the largest week over week growth of the top 5 “mover and shaker” markets.

The average number of attendees for the week was 87, while the average square footage used was 2,100 per event, and square feet used per person was 24.

Hot Trends June 22 2024

The top five segments for the week were: National Association, Education, Charity/Non-Profit/Social Services, Healthcare and Technology.

The full list of top growth market movers and shakers were: Anaheim-Santa Ana, Tula, Wisconsin, Orlando, Long Island and Nevada (excluding Las Vegas), for the largest week over week volume change.

Market Avg Group Size Avg Space Used Sq Ft
Anaheim-Santa Ana, CA 115 2,496
Tulsa, OK 233 5,518
Wisconsin South 32 4,819
Orlando, FL 29 2,144
Long Island 25 1,923
Nevada (exc Las Vegas) 25 1,825

These numbers and markets change weekly based on market dynamics and social trends.

Knowland tracks the weekly event activity across 166 U.S. markets with more globally and is expanding coverage regularly.

Talk to a Knowland data expert today for sneak peek at your market trends

Category iconHot Data Trends Tag icon2024 Meeting Trends,  Anaheim Meeting Trends,  Weekly Group Business Trends

Primary Sidebar

Footer

  • Solutions
    • Hotel Properties
    •   – Knowland Classic
    •   – Knowland Select
    • Above Property Management
    •   – Portfolio Capture
    •   – Market Analytics
    • CVBs and DMOs
    • Features & Pricing
    • Try for Free >
    • Demo Request >
  • Resources
    • Hospitality Group & Business Performance Index
    • Success Stories
    • White Papers & Datasheets
    • Webcasts & Events
    • Blog
    • Sales Calculator
    • Glossary
  • Customers
    • Customer Sign In >
    • Support & Training
    • Billing Inquiries >
  • About Us
    • Meet Knowland
    • Culture
    • Job Openings
    • Press & Media
    • Sustainability
    • Contact Us >

[email protected]

[email protected]

202-312-5880

2300 Wilson Blvd. Ste 700 Arlington, VA 22201

Subscribe for news and updates

© 2004–2025 Knowland Group

Privacy Policy

Cookie Settings