• Skip to primary navigation
  • Skip to main content
  • Skip to primary sidebar
  • Skip to footer
Knowland

Knowland

  • Solutions
    • Hotel Properties
      • Knowland Classic
      • Knowland Select
    • Above Property Management
      • Portfolio Capture
      • Market Analytics
    • CVBs and DMOs
    • Features & Pricing
  • Resources
    • Hospitality Group & Business Performance Index
    • Success Stories
    • White Papers & Datasheets
    • Webcasts & Events
    • Blog
    • Sales Calculator
    • Glossary
  • Customers
    • Customer Sign In >
    • Support & Training
    • Billing Inquiries >
  • About Us
    • Meet Knowland
    • Culture
    • Job Openings
    • Press & Media
    • Sustainability
    • Contact Us
  • Support
  • Sign In
  • Try for Free
  • Request a Demo
  • Support
  • Sign In >
TRY FOR FREE REQUEST DEMO

Weekly Group Meetings and Events Stats, Week Ending June 8, 2024

June 12, 2024

Atlanta takes the top meeting growth market as this week jumps 47%

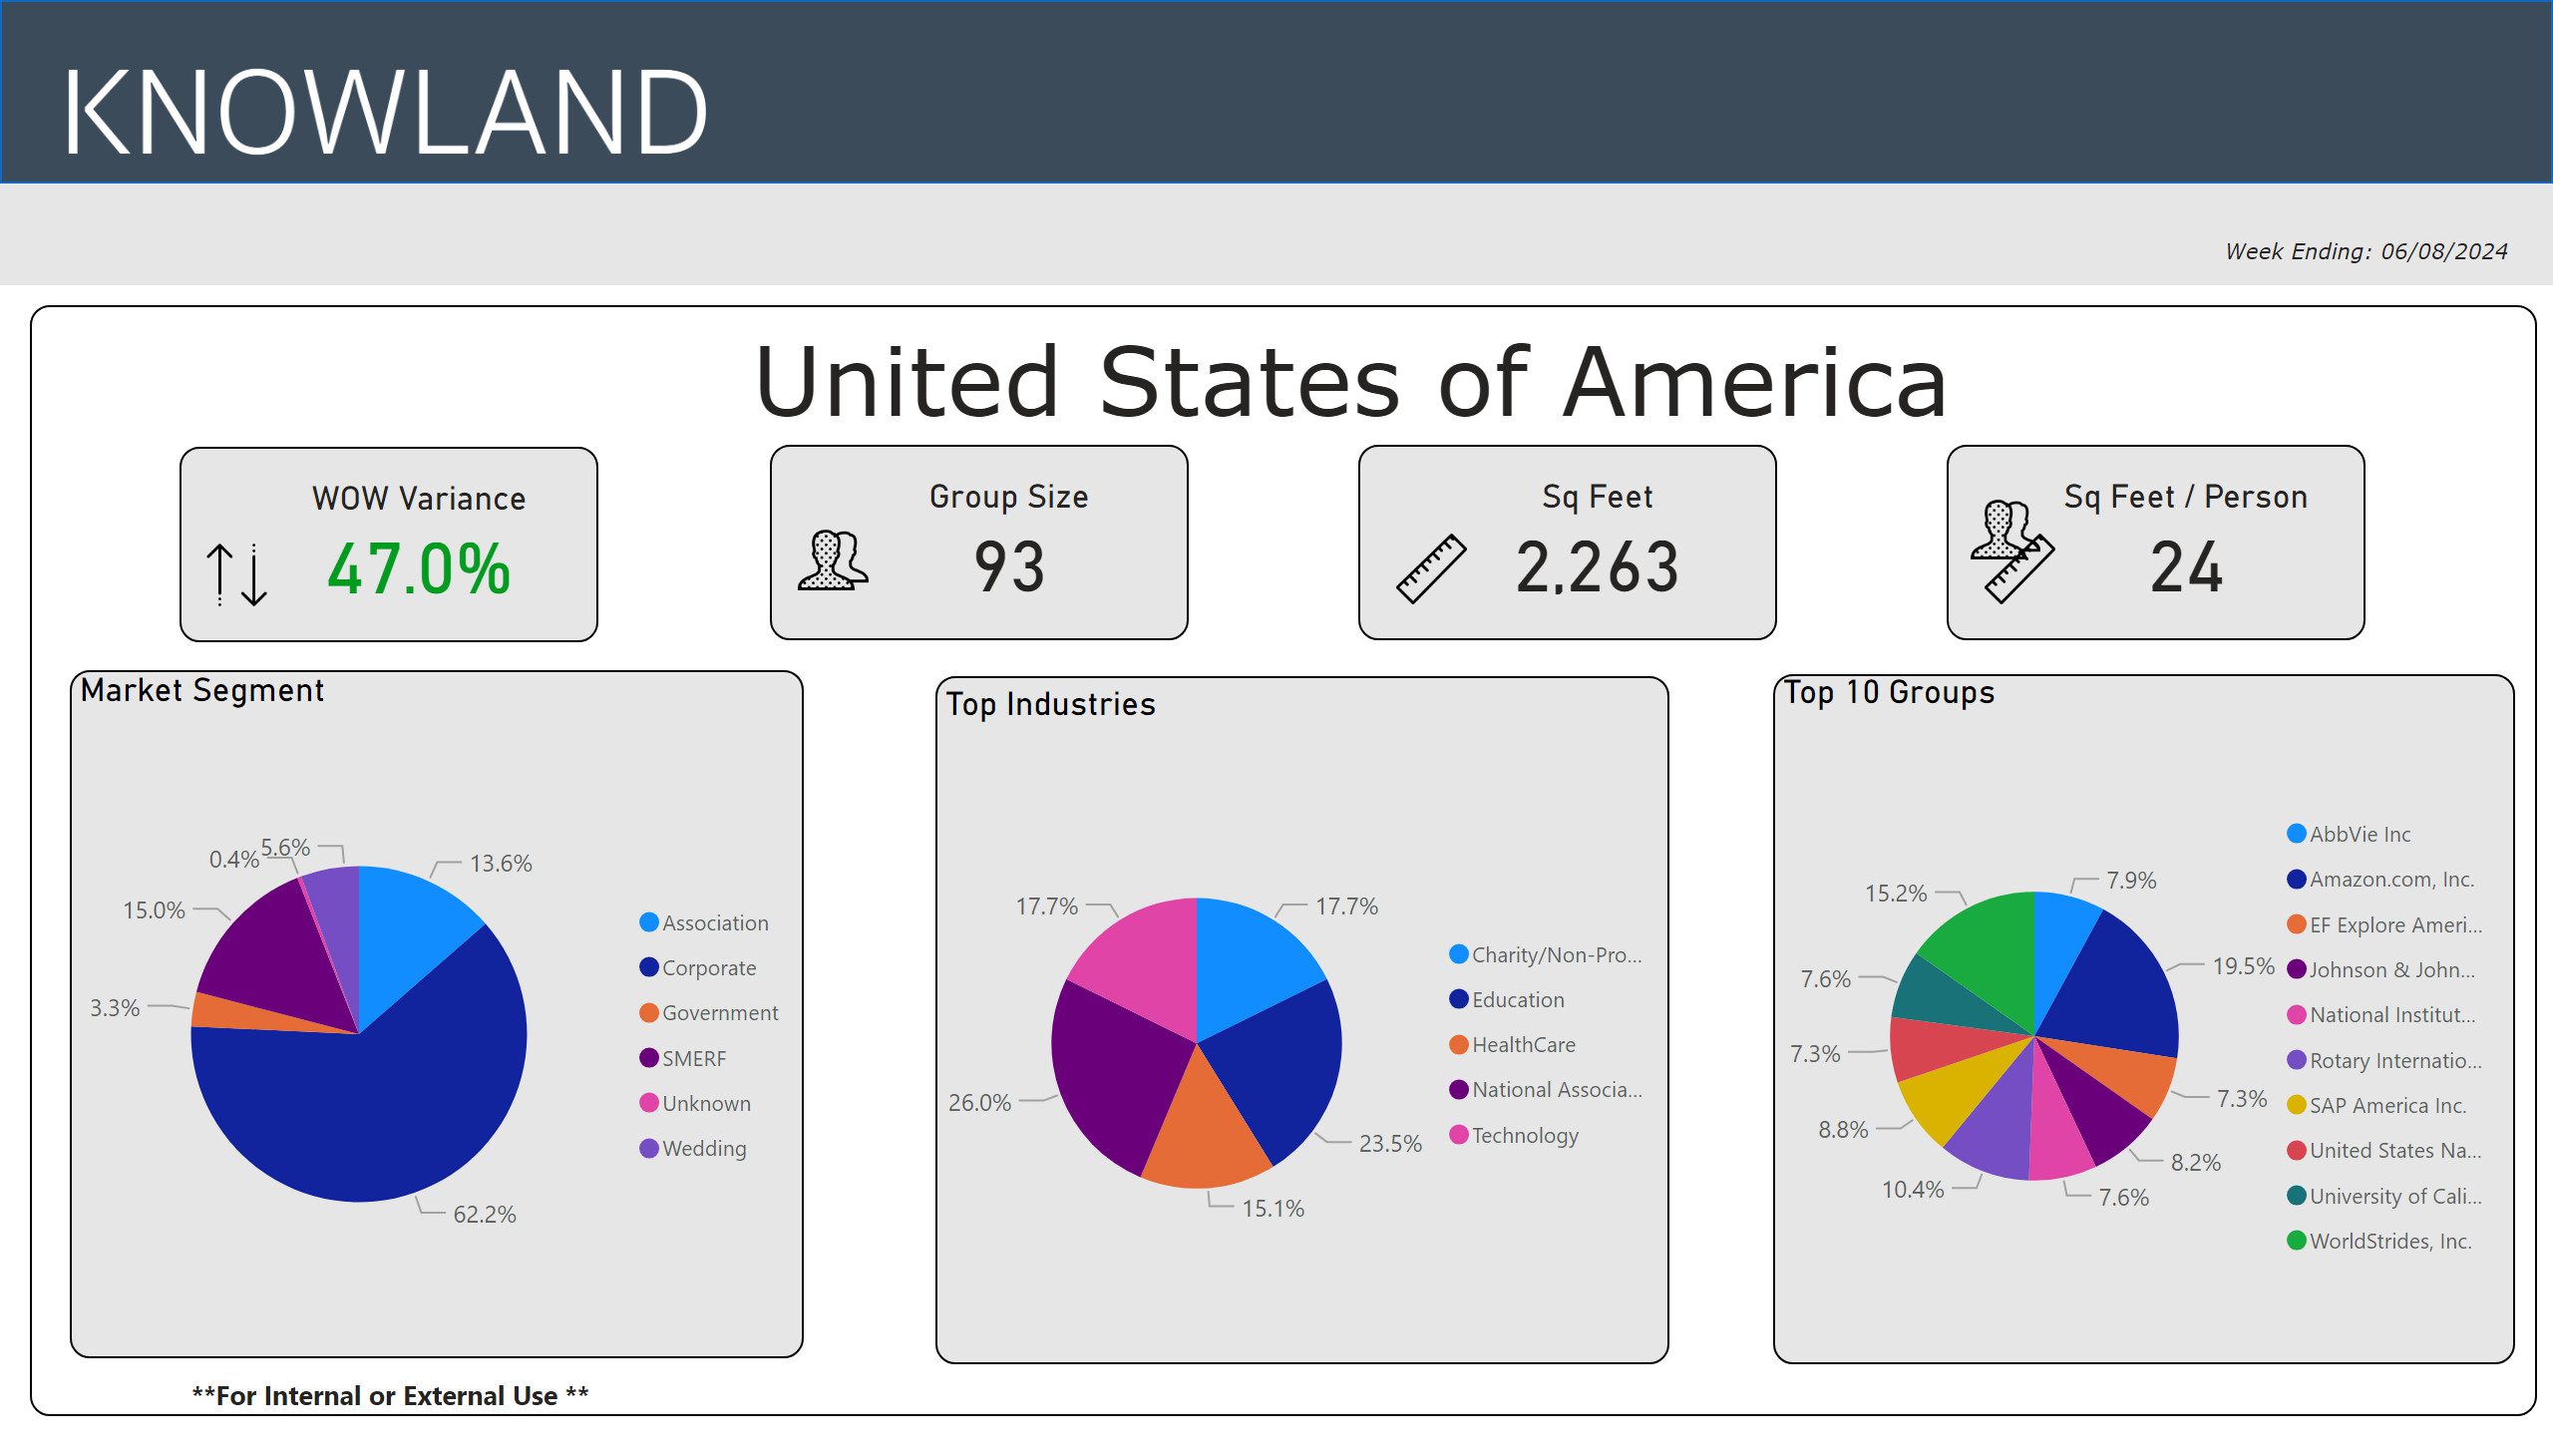
For the week ending June 8, 2024, the number of U.S. meetings and events jumped 47.0% compared to the previous week, recovering from the seasonal dip into summer. Corporate events share volume is 62.2%, with National Association and Education segments leading growth with 26.0% and 23.5% share respectively, for the top five segments. Atlanta showed the largest week over week growth of the top 5 “mover and shaker” markets.

The average number of attendees for the week was up to 93, while the average square footage used was 2,263 per event, and square feet used per person was 24.

Hot trends June 8 2024

The top five segments for the week were: Education, National Association, Charity/Non-Profit/Social Services, Technology, and Healthcare.

The full list of top growth market movers and shakers were: Atlanta, Washington DC, Orlando, Boston and Chicago, for the largest week over week volume change.

Market Average Group Size Average Sq Ft Used
Atlanta, GA 78 1,992
Washington DC-MD-VA 105 2,662
Orlando, FL 71 1,972
Boston, MA 75 1,598
Chicago, IL 86 2,184

These numbers and markets change weekly based on market dynamics and social trends.

Knowland tracks the weekly event activity across 166 U.S. markets with more globally and is expanding coverage regularly.

Talk to a Knowland data expert today for sneak peek at your market trends

Category iconHot Data Trends Tag icon2024 Meeting Trends,  Atlanta Meetings and Events 2024,  Weekly Group Business Trends

Primary Sidebar

Footer

  • Solutions
    • Hotel Properties
    •   – Knowland Classic
    •   – Knowland Select
    • Above Property Management
    •   – Portfolio Capture
    •   – Market Analytics
    • CVBs and DMOs
    • Features & Pricing
    • Try for Free >
    • Demo Request >
  • Resources
    • Hospitality Group & Business Performance Index
    • Success Stories
    • White Papers & Datasheets
    • Webcasts & Events
    • Blog
    • Sales Calculator
    • Glossary
  • Customers
    • Customer Sign In >
    • Support & Training
    • Billing Inquiries >
  • About Us
    • Meet Knowland
    • Culture
    • Job Openings
    • Press & Media
    • Sustainability
    • Contact Us >

[email protected]

[email protected]

202-312-5880

2300 Wilson Blvd. Ste 700 Arlington, VA 22201

Subscribe for news and updates

© 2004–2025 Knowland Group

Privacy Policy

Cookie Settings