• Skip to primary navigation
  • Skip to main content
  • Skip to primary sidebar
  • Skip to footer
Knowland

Knowland

  • Solutions
    • Hotel Properties
    • Above Property Management
      • Portfolio Capture
      • Market Analytics
    • Convention Centers and Other Venues
    • Features & Pricing
  • Resources
    • Meetings Recovery Forecast
    • Success Stories
    • White Papers & Datasheets
    • Webcasts & Events
    • Blog
    • Sales Calculator
    • Glossary
  • Customers
    • Customer Sign In >
    • Support & Training
    • Billing Inquiries >
  • About Us
    • Meet Knowland
    • Culture
    • Job Openings
    • Press & Media
    • Sustainability
    • Contact Us
  • Support
  • Sign In
  • Try for Free
  • Request a Demo
  • Support
  • Sign In >
TRY FOR FREE REQUEST DEMO

Weekly Group Business Trends, Week Ending July 9, 2022

July 13, 2022

SMERF segments are the big “meeters” for this holiday week

The long summer weekend followed seasonal trends with lower meeting volume week over week and tee’d up changes in the meeting markets and top industries mix. Meetings and events decreased over 30% compared to the prior week. Event activity is expected to rebound as we move past the extended holiday.

The average number of attendees for the week was up to 84 people, while the average square footage used was 1,776 per event and square feet used per person was 21.

July 9 trends


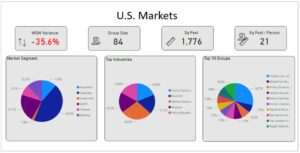
The corporate market segment represented almost 45% of overall business for the week. This holiday week, top segments were highest for the SMERF segment as Charity and Religious events made it into the top five segments: National Association, Charity Organizations, Religious, Education, and Training/Education.

Markets with the highest week over week variance for number of meetings were Wisconsin North, Florida Panhandle, Sarasota-Bradenton, FL, Oahu Island, HI, and Delaware. The Florida Panhandle led with the highest average attendees at 283.

Market Average Attendees Average Square Footage Used
Wisconsin North 211 4,280
Florida Panhandle 283 5,167
Sarasota-Bradenton, FL 123 2,895
Oahu Island, HI 187 4,260
Delaware 105 2,053

These numbers and markets change weekly. These markets are outside the top 25, so reflect event growth in secondary and tertiary markets. See the details across markets here in the Meetings Recovery Forecast.

Knowland tracks the weekly event activity across 113 markets globally and is expanding coverage regularly.

Ready to see what is happening in your market today? Schedule a free market analysis to find out.

Category iconHot Data Trends Tag iconWeekly Group Business Trends

Primary Sidebar

Footer

  • Solutions
    • Hotel Properties
    • Above Property Management
    •   – Portfolio Capture
    •   – Market Analytics
    • Convention Centers and Other Venues
    • Features & Pricing
    • Try for Free >
    • Demo Request >
  • Resources
    • Meetings Recovery Forecast
    • Success Stories
    • White Papers & Datasheets
    • Webcasts & Events
    • Blog
    • Sales Calculator
    • Glossary
  • Customers
    • Customer Sign In >
    • Support & Training
    • Billing Inquiries >
  • About Us
    • Meet Knowland
    • Culture
    • Job Openings
    • Press & Media
    • Sustainability
    • Contact Us >

LinkedIn Profile Twitter Profile Facebook Profile

info@knowland.com

clientcare@knowland.com

202-312-5880

2300 Wilson Blvd. Ste 700 Arlington, VA 22201

Subscribe for news and updates

© 2004–2023 Knowland Group

Privacy Policy

Cookie Settings