• Skip to primary navigation
  • Skip to main content
  • Skip to primary sidebar
  • Skip to footer
Knowland

Knowland

  • Solutions
    • Hotel Properties
      • Knowland Classic
      • Knowland Select
    • Above Property Management
      • Portfolio Capture
      • Market Analytics
    • CVBs and DMOs
    • Features & Pricing
  • Resources
    • Hospitality Group & Business Performance Index
    • Success Stories
    • White Papers & Datasheets
    • Webcasts & Events
    • Blog
    • Sales Calculator
    • Glossary
  • Customers
    • Customer Sign In >
    • Support & Training
    • Billing Inquiries >
  • About Us
    • Meet Knowland
    • Culture
    • Job Openings
    • Press & Media
    • Sustainability
    • Contact Us
  • Support
  • Sign In
  • Try for Free
  • Request a Demo
  • Support
  • Sign In >
TRY FOR FREE REQUEST DEMO

STR: U.S. Hotel Results for the Week Ending June 13

June 23, 2020

HENDERSONVILLE, Tennessee—U.S. hotel performance data ending with 13 June showed another small rise from previous weeks and less severe year-over-year declines, according to STR.

7-13 June 2020 (percentage change from comparable week in 2019):

  • Occupancy: 41.7% (-43.4%)
  • Average daily rate (ADR): US$89.09 (-33.9%)
  • Revenue per available room (RevPAR): US$37.15 (-62.6%)

“Powered by the slow and steady rise in weekly demand, the industry clawed its way above 40% occupancy,” said Alison Hoyt, STR’s senior director, consulting & analytics. “That was still down substantially from the comparable week last year (73.6%) but an obvious improvement from the country’s low point in mid-April. As we have noted, the drive-to destinations with access to beaches, mountains and parks continue to lead the early leisure recovery. With more consistent demand, we’re beginning to see more pricing confidence in those areas as well.”
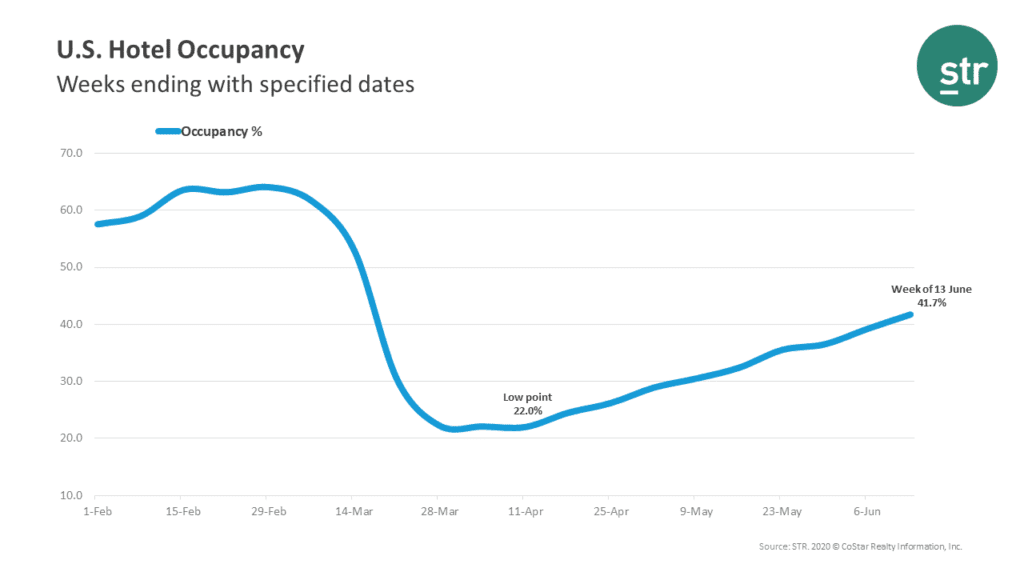
Source: STR 2020 (c) CoStar Realty Information, Inc.

Aggregate data for the Top 25 Markets showed lower occupancy (37.2%) than the national average, but slightly higher ADR (US$91.65).

Norfolk/Virginia Beach, Virginia, was the only one of those major markets to reach a 50% occupancy level (53.3%).

The next highest occupancy levels were registered in Phoenix, Arizona (47.6%); New York, New York (45.7%); and Tampa/St. Petersburg, Florida (44.7%).

Markets with the lowest occupancy levels for the week included Oahu Island, Hawaii (10.8%); Boston, Massachusetts (25.7%); and Orlando, Florida (26.4%).

Of note, in Seattle, Washington, occupancy was 31.5%, up slightly from 29.5% the week prior.

Source: STR © CoStar Group, Inc.

Category iconFinance

Primary Sidebar

Footer

  • Solutions
    • Hotel Properties
    •   – Knowland Classic
    •   – Knowland Select
    • Above Property Management
    •   – Portfolio Capture
    •   – Market Analytics
    • CVBs and DMOs
    • Features & Pricing
    • Try for Free >
    • Demo Request >
  • Resources
    • Hospitality Group & Business Performance Index
    • Success Stories
    • White Papers & Datasheets
    • Webcasts & Events
    • Blog
    • Sales Calculator
    • Glossary
  • Customers
    • Customer Sign In >
    • Support & Training
    • Billing Inquiries >
  • About Us
    • Meet Knowland
    • Culture
    • Job Openings
    • Press & Media
    • Sustainability
    • Contact Us >

[email protected]

[email protected]

202-312-5880

2300 Wilson Blvd. Ste 700 Arlington, VA 22201

Subscribe for news and updates

© 2004–2025 Knowland Group

Privacy Policy

Cookie Settings