• Skip to primary navigation
  • Skip to main content
  • Skip to footer
Knowland

Knowland

  • Solutions
    • Hotel Properties
    • Above Property Management
      • Portfolio Capture
      • Market Analytics
    • Convention Centers and Other Venues
    • Features & Pricing
  • Resources
    • Meetings Recovery Forecast
    • Success Stories
    • White Papers & Datasheets
    • Webcasts & Events
    • Blog
    • Sales Calculator
    • Glossary
  • Customers
    • Customer Sign In >
    • Support & Training
    • Billing Inquiries >
  • About Us
    • Meet Knowland
    • Culture
    • Job Openings
    • Press & Media
    • Sustainability
    • Contact Us
  • Support
  • Sign In
  • Try for Free
  • Request a Demo
  • Support
  • Sign In >
TRY FOR FREE REQUEST DEMO

Weekly Group Business Trends, Week Ending March 12, 2022

March 16, 2022

Third consecutive week of event activity growth in the U.S.

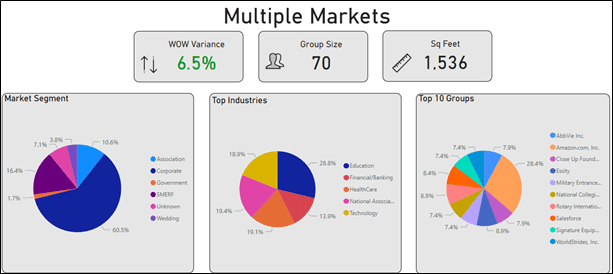
For the week of March 6-12, 2022, there was a 6.5% increase in event activity from the prior week. This represents the third week in a row with growth for the United States.

Additionally, the average number of attendees for the week was 70 people while the average square footage used was 1,536 per event.

Market Insights

The corporate market segment represented 62.6% of overall business for the week. SMERF-Education, Manufacturing, National Association, Technology, and Training/Education were the top industry segments

The individual markets with the highest week over week growth were Seattle, Louisville, Greensboro-Winston Salem, Birmingham, and New Orleans. The average growth for these markets was 128.2% week over week.

Market Average Attendees Average Square Footage Used
Seattle, WA 46 1,548
Louisville, KY 54 1,126
Greensboro-Winston Salem, NC 39 629
Birmingham, AL 48 1,049
New Orleans 71 1,342

Greensboro-Winston Salem and New Orleans had the lowest space to attendee ratio while Seattle had the highest. These numbers evolve every week but are in line with trends of markets at different stages of recovery.

For more information on Knowland data trends, visit the Knowland Meeting Recovery Forecast, a prediction for the status of the U.S. and the Top 25 market and when it will reach 100%+ of 2019 market levels.

Ready to see what is happening in your market today? Schedule a free market analysis to find out.

Knowland tracks the weekly event activity across 108 markets across the United States.

Category iconHot Data Trends Tag iconWeekly Group Business Trends

Footer

  • Solutions
    • Hotel Properties
    • Above Property Management
    •   – Portfolio Capture
    •   – Market Analytics
    • Convention Centers and Other Venues
    • Features & Pricing
    • Try for Free >
    • Demo Request >
  • Resources
    • Meetings Recovery Forecast
    • Success Stories
    • White Papers & Datasheets
    • Webcasts & Events
    • Blog
    • Sales Calculator
    • Glossary
  • Customers
    • Customer Sign In >
    • Support & Training
    • Billing Inquiries >
  • About Us
    • Meet Knowland
    • Culture
    • Job Openings
    • Press & Media
    • Sustainability
    • Contact Us >

LinkedIn Profile Twitter Profile Facebook Profile

info@knowland.com

clientcare@knowland.com

202-312-5880

2300 Wilson Blvd. Ste 700 Arlington, VA 22201

Subscribe for news and updates

© 2004–2023 Knowland Group

Privacy Policy

Cookie Settings