• Skip to primary navigation
  • Skip to main content
  • Skip to footer
Knowland

Knowland

  • Solutions
    • Hotel Properties
    • Above Property Management
      • Portfolio Capture
      • Market Analytics
    • Convention Centers and Other Venues
    • Features & Pricing
  • Resources
    • Meetings Recovery Forecast
    • Success Stories
    • White Papers & Datasheets
    • Webcasts & Events
    • Blog
    • Sales Calculator
    • Glossary
  • Customers
    • Customer Sign In >
    • Support & Training
    • Billing Inquiries >
  • About Us
    • Meet Knowland
    • Culture
    • Job Openings
    • Press & Media
    • Sustainability
    • Contact Us
  • Support
  • Sign In
  • Try for Free
  • Request a Demo
  • Support
  • Sign In >
TRY FOR FREE REQUEST DEMO

Weekly Group Business Trends, Week Ending April 2, 2022

April 5, 2022

Event activity shows slight decrease for the week, aligned with native seasonality

While there was a minor dip this week, it was insignificant when compared to the growth of the prior three weeks. All other metrics were in line with prior weeks showing group activity remains stable with simple, periodic ebbs that occur with native seasonality.

For the week of March 27 – April 2, 2022, there was a 1.8% decrease in event activity from the prior week.

Additionally, the average number of attendees for the week was 77 people while the average square footage used was 1,772 per event.

Weekly Data Trends Ending 040222

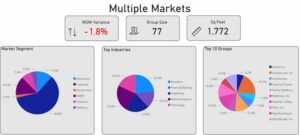
The corporate market segment represented 59.8% of overall business for the week. Education, National Association, HealthCare, Technology, and Financial/Banking were the top industry segments

The individual markets with the highest week over week growth were San Antonio, Miami, Washington DC, Dallas and Las Vegas. The average growth for these markets was 50.1% week over week.

Market Average Attendees Average Square Footage Used
San Antonio, TX 49 960
Miami – Hialeah, FL 71 1,732
Washington, D.C. 94 1,680
Dallas, TX 79 1,890
Las Vegas, NV 119 6,996

San Antonio and Washington, D.C. had the lowest space to attendee ratio while Las Vegas had the highest. These numbers evolve every week but are in line with trends of markets at different stages of recovery.

Knowland tracks the weekly event activity across 108 markets across the United States.

Ready to see what is happening in your market today? Schedule a free market analysis to find out.

Category iconHot Data Trends Tag iconWeekly Group Business Trends

Footer

  • Solutions
    • Hotel Properties
    • Above Property Management
    •   – Portfolio Capture
    •   – Market Analytics
    • Convention Centers and Other Venues
    • Features & Pricing
    • Try for Free >
    • Demo Request >
  • Resources
    • Meetings Recovery Forecast
    • Success Stories
    • White Papers & Datasheets
    • Webcasts & Events
    • Blog
    • Sales Calculator
    • Glossary
  • Customers
    • Customer Sign In >
    • Support & Training
    • Billing Inquiries >
  • About Us
    • Meet Knowland
    • Culture
    • Job Openings
    • Press & Media
    • Sustainability
    • Contact Us >

LinkedIn Profile Twitter Profile Facebook Profile

info@knowland.com

clientcare@knowland.com

202-312-5880

2300 Wilson Blvd. Ste 700 Arlington, VA 22201

Subscribe for news and updates

© 2004–2023 Knowland Group

Privacy Policy

Cookie Settings